Screenshots
A visual tour of NetPulse. The data below is seeded demo data, so every chart and table is populated.
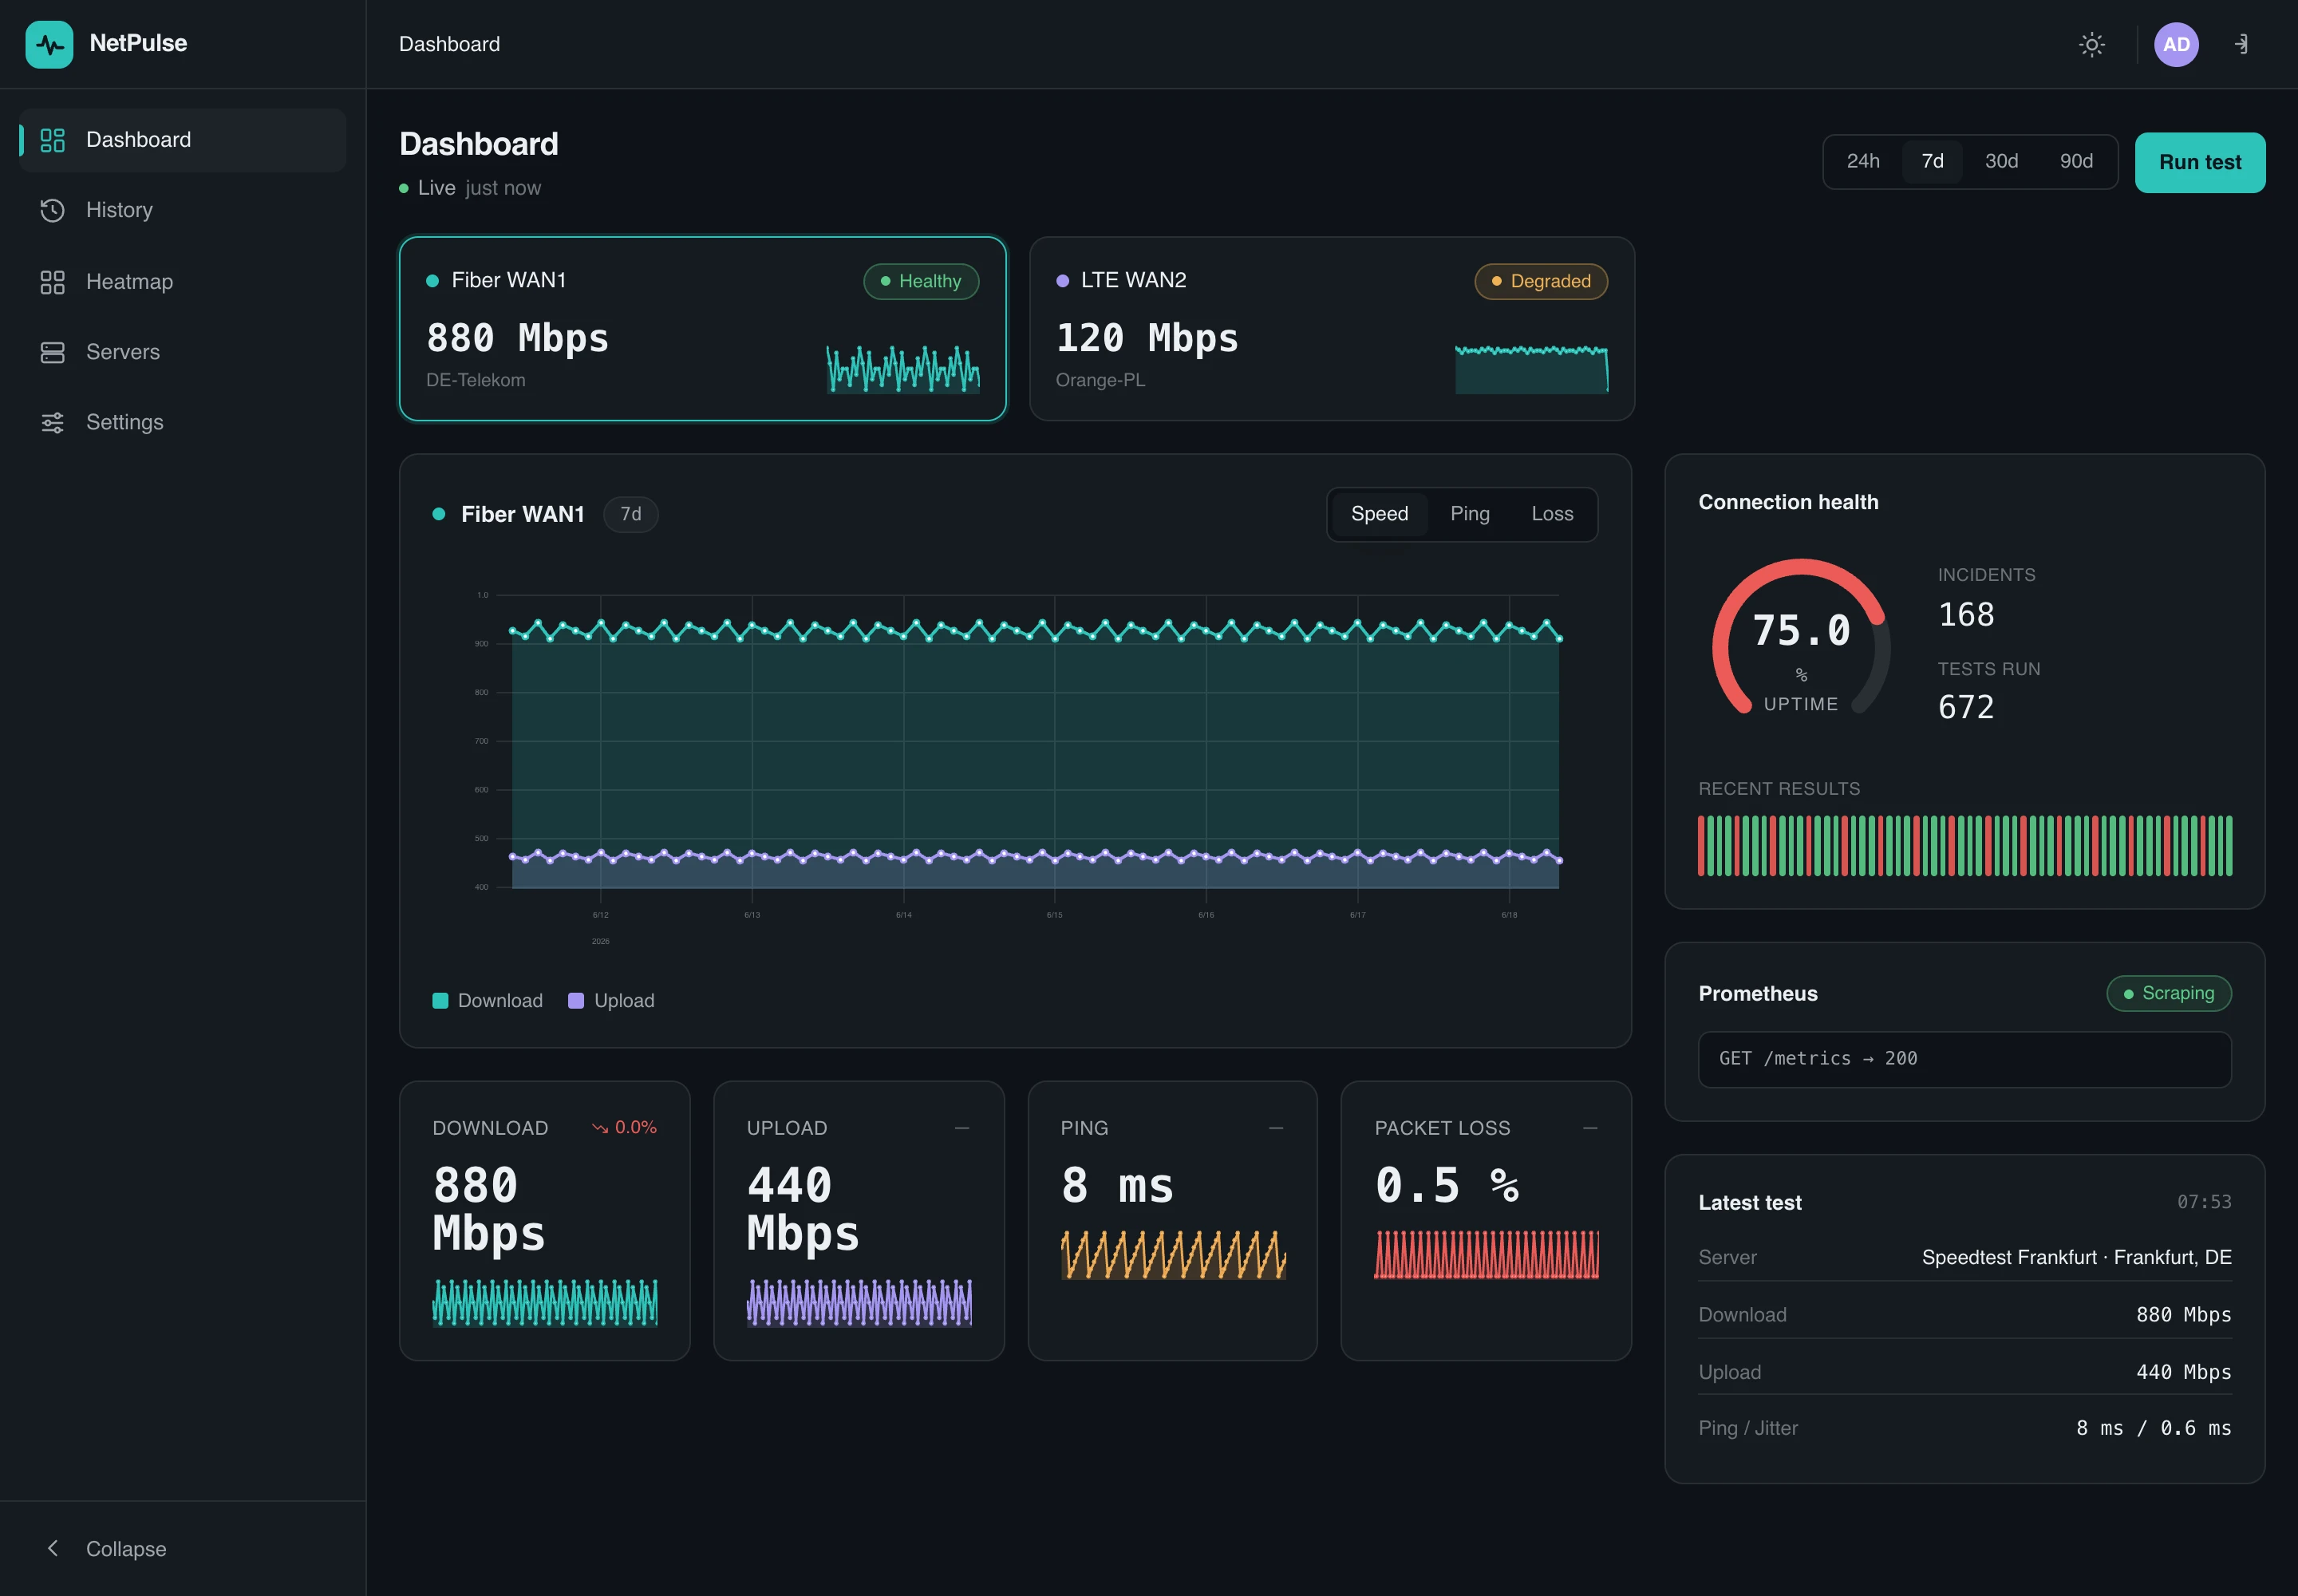
Dashboard
Live download / upload / ping / packet-loss, per-connection health, trend tiles and sparklines — with a one-click Run test and a Prometheus scrape indicator.
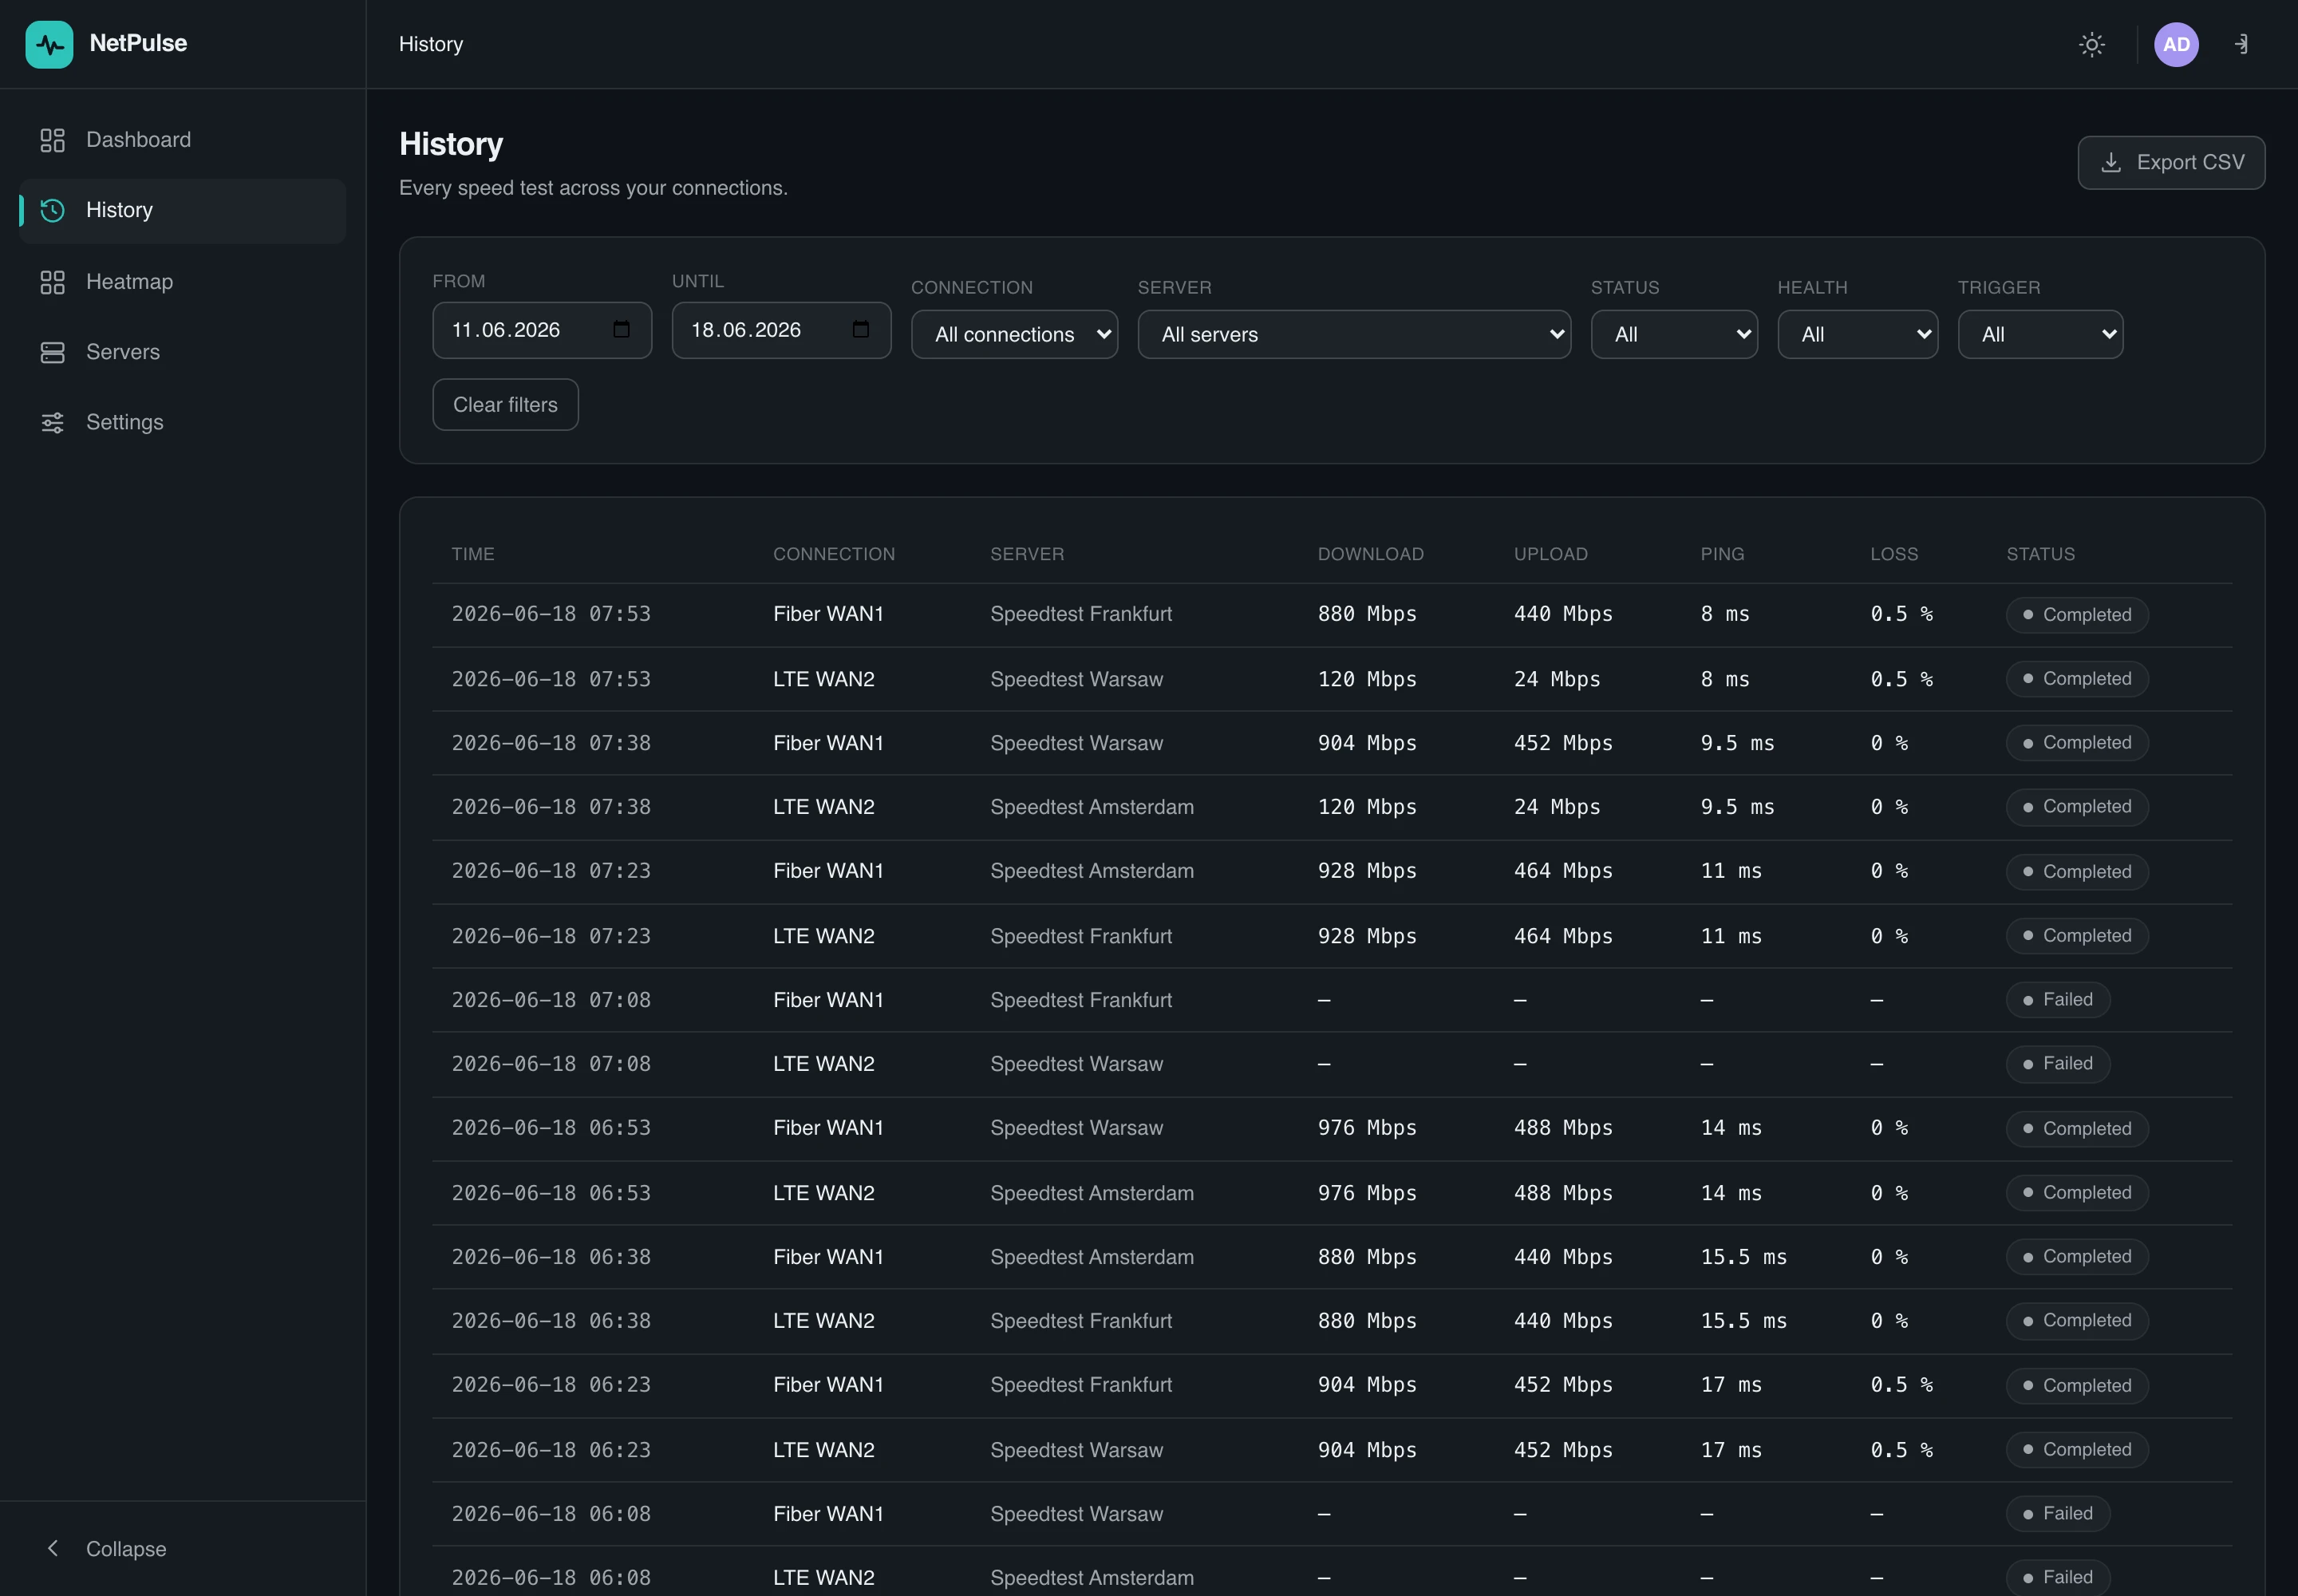
History
Every measurement across all connections, filterable by date, connection, server and status, sortable, with CSV export.
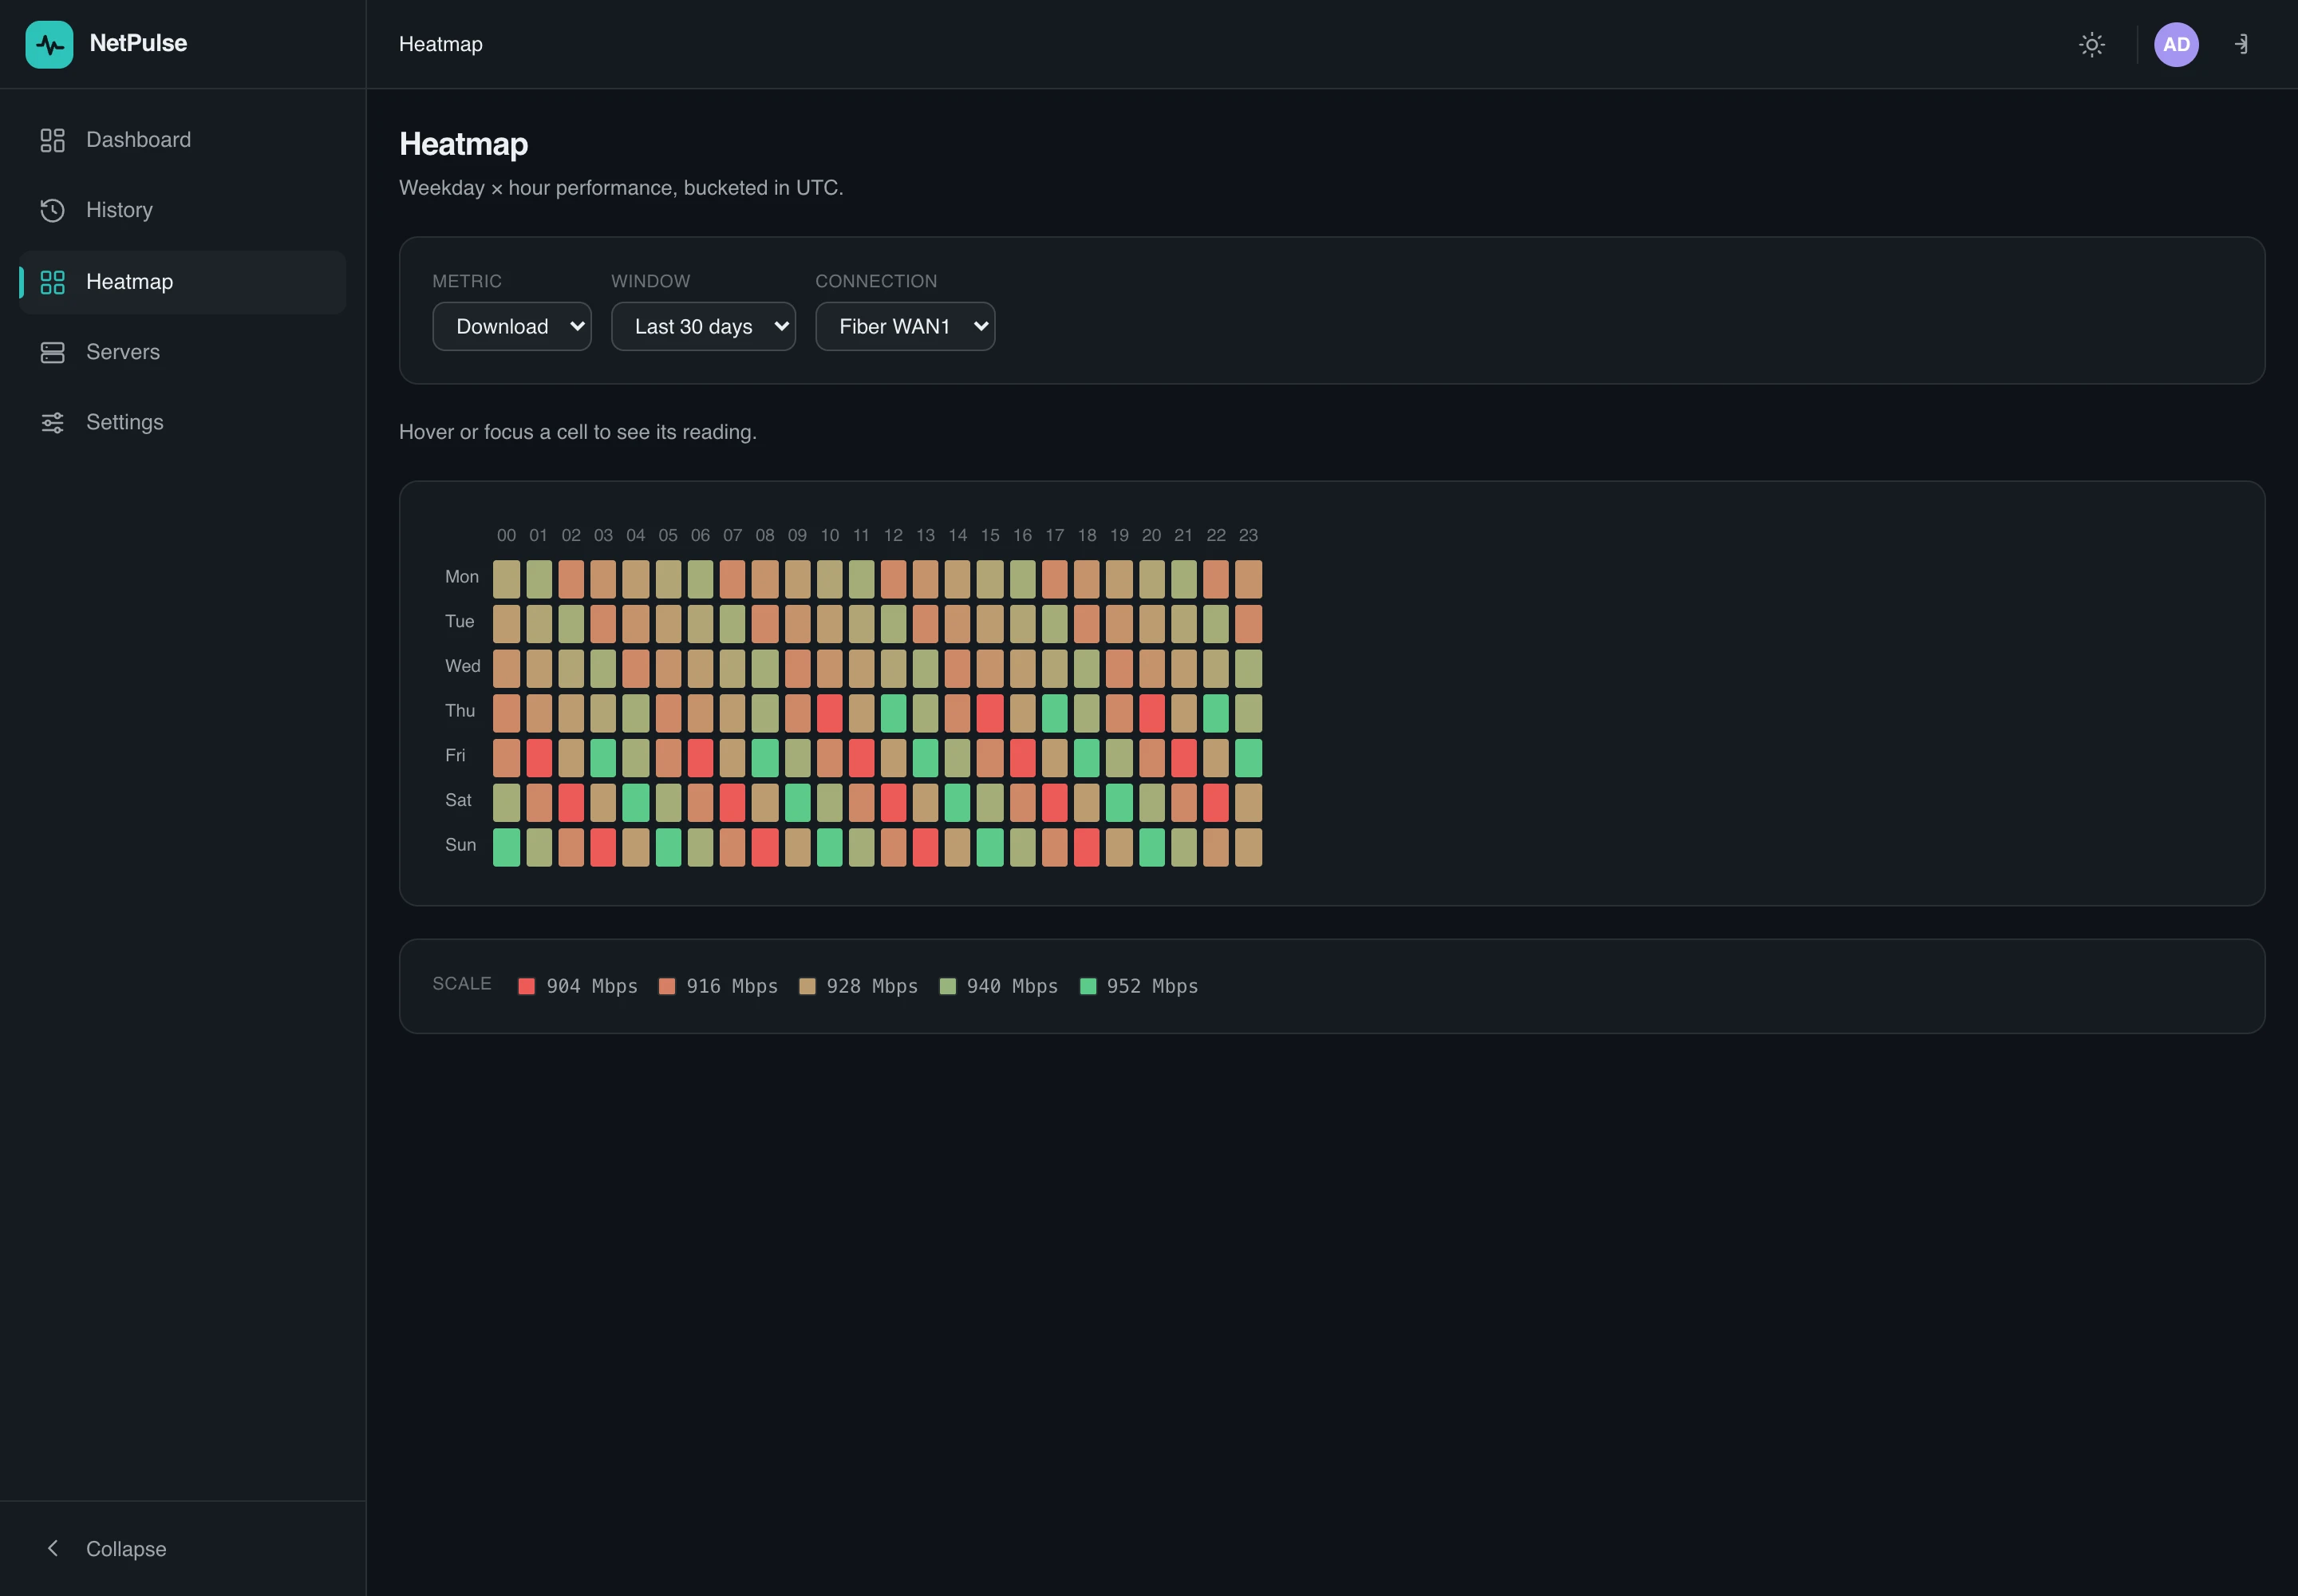
Heatmap
A weekday × hour-of-day matrix that shows when a connection is consistently slow or unhealthy.
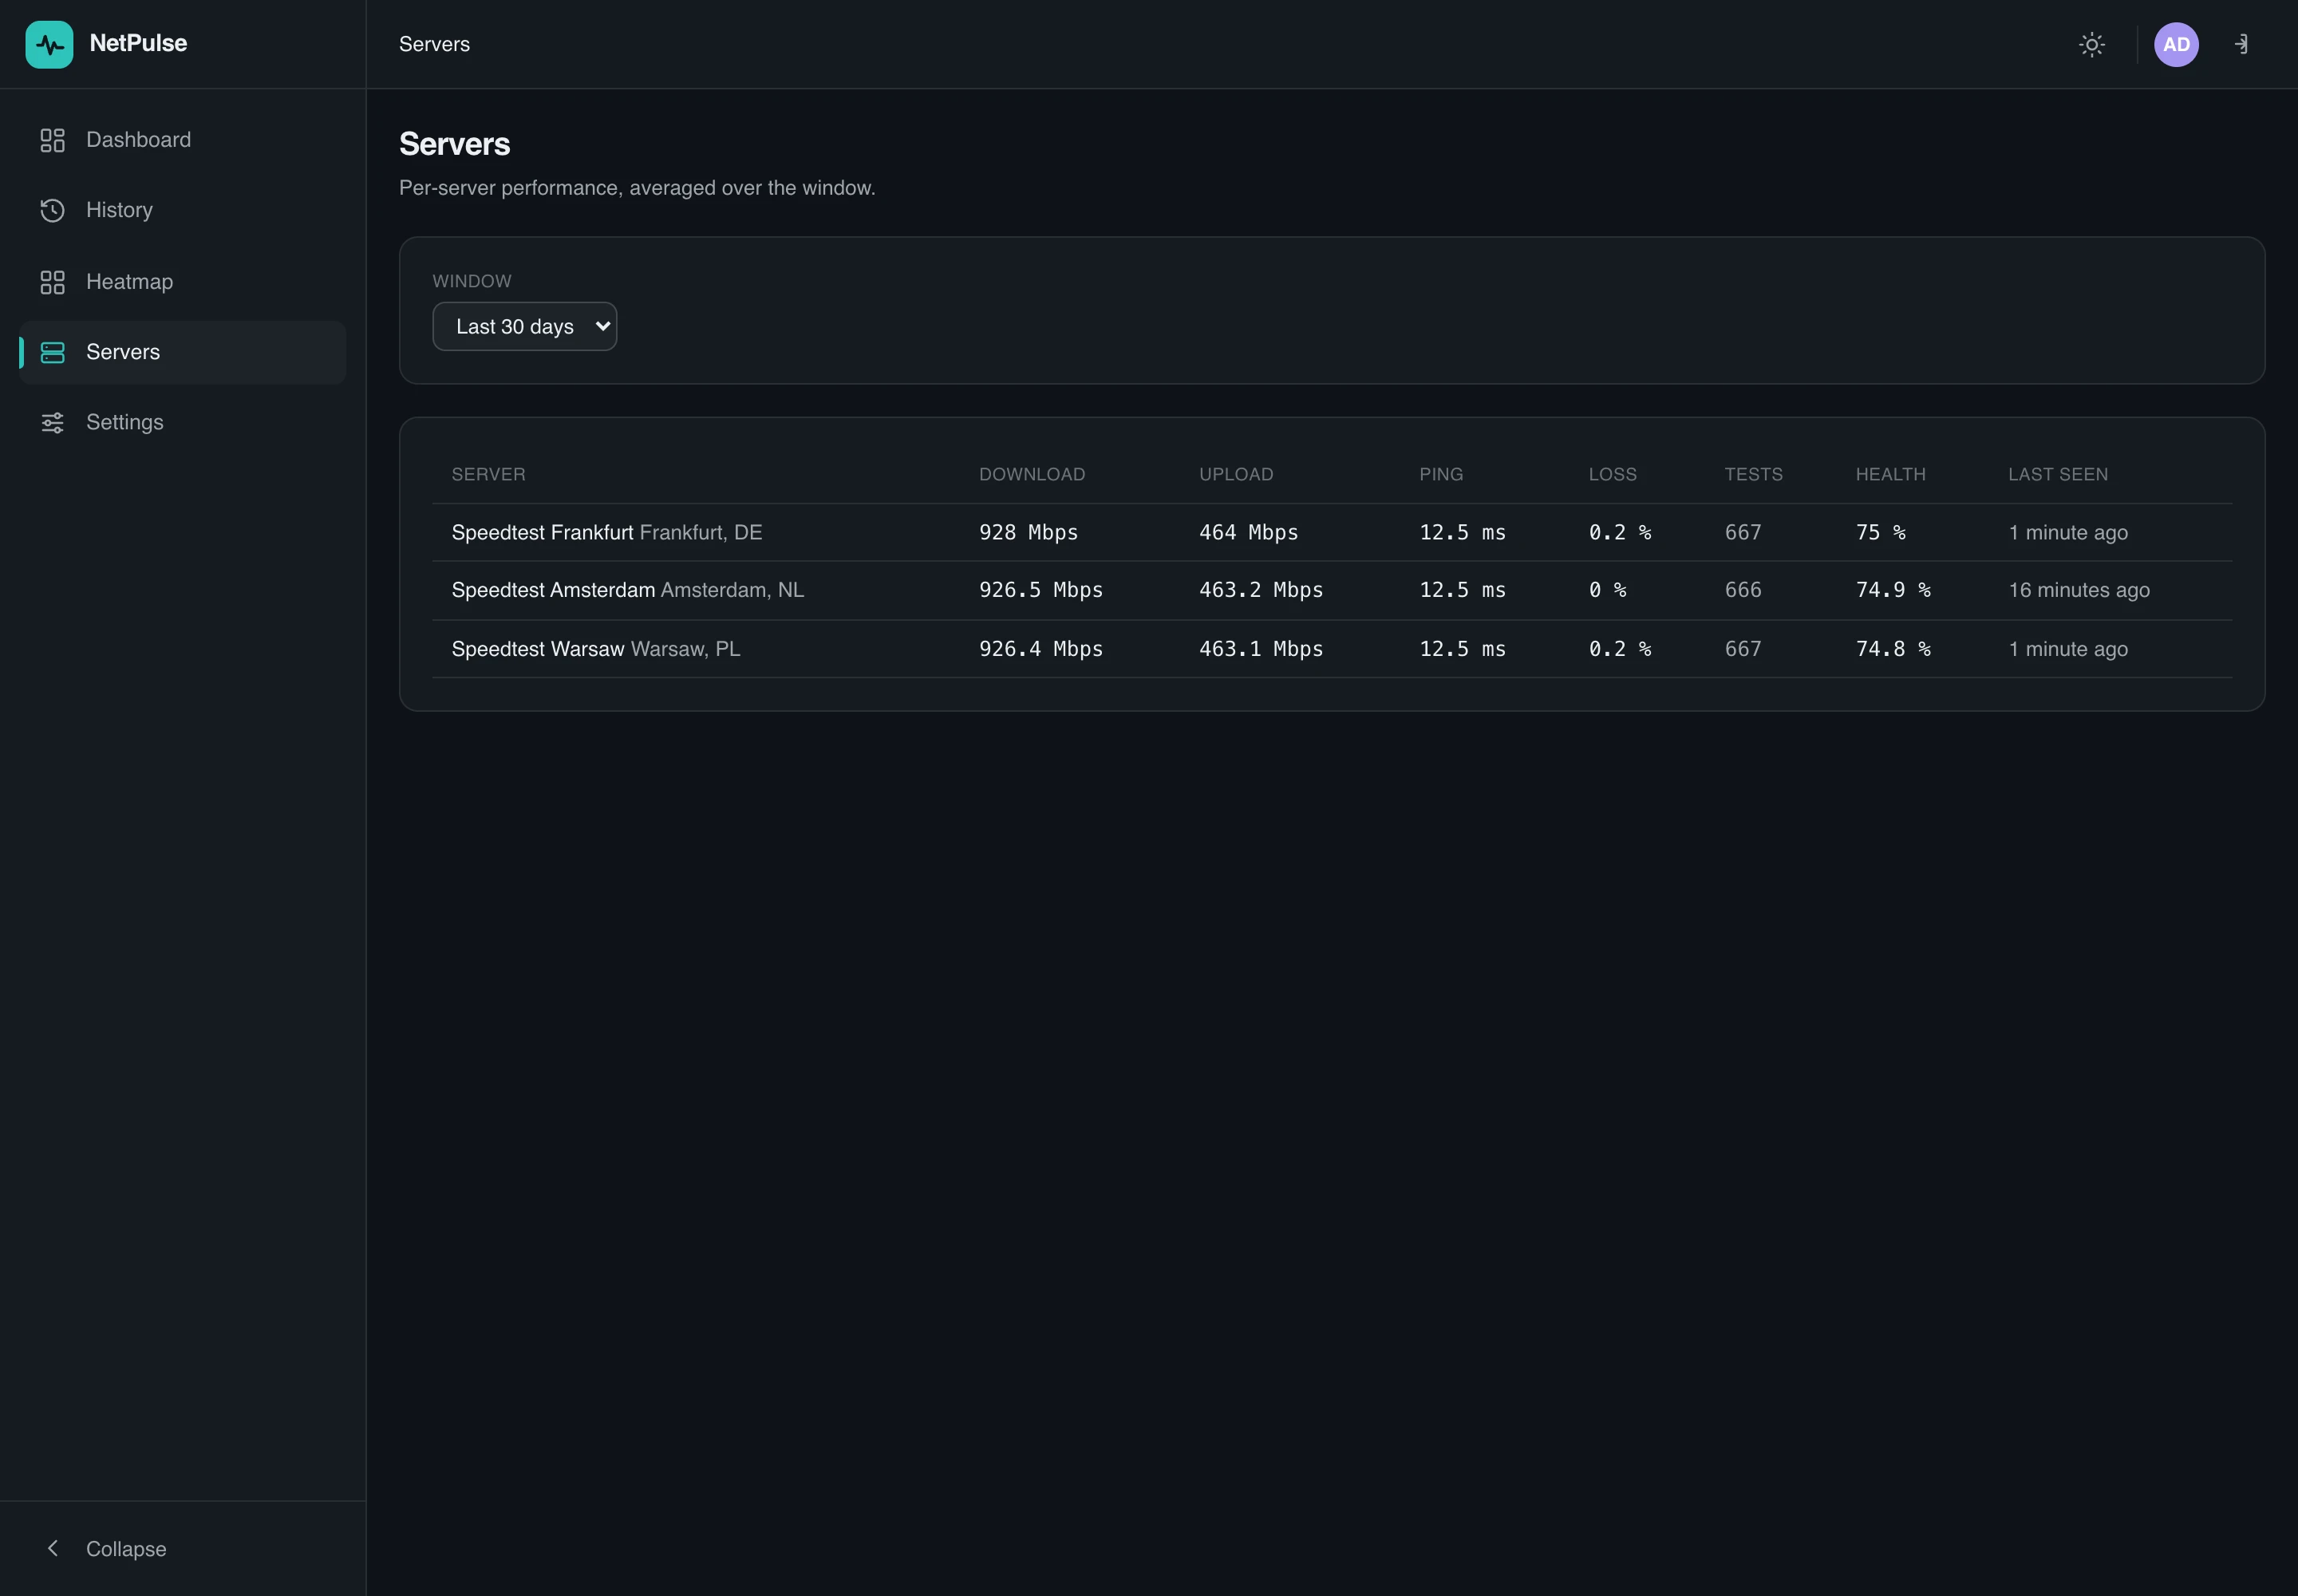
Per-server performance
Averages per Ookla server over the selected window — handy for spotting a single bad test server.
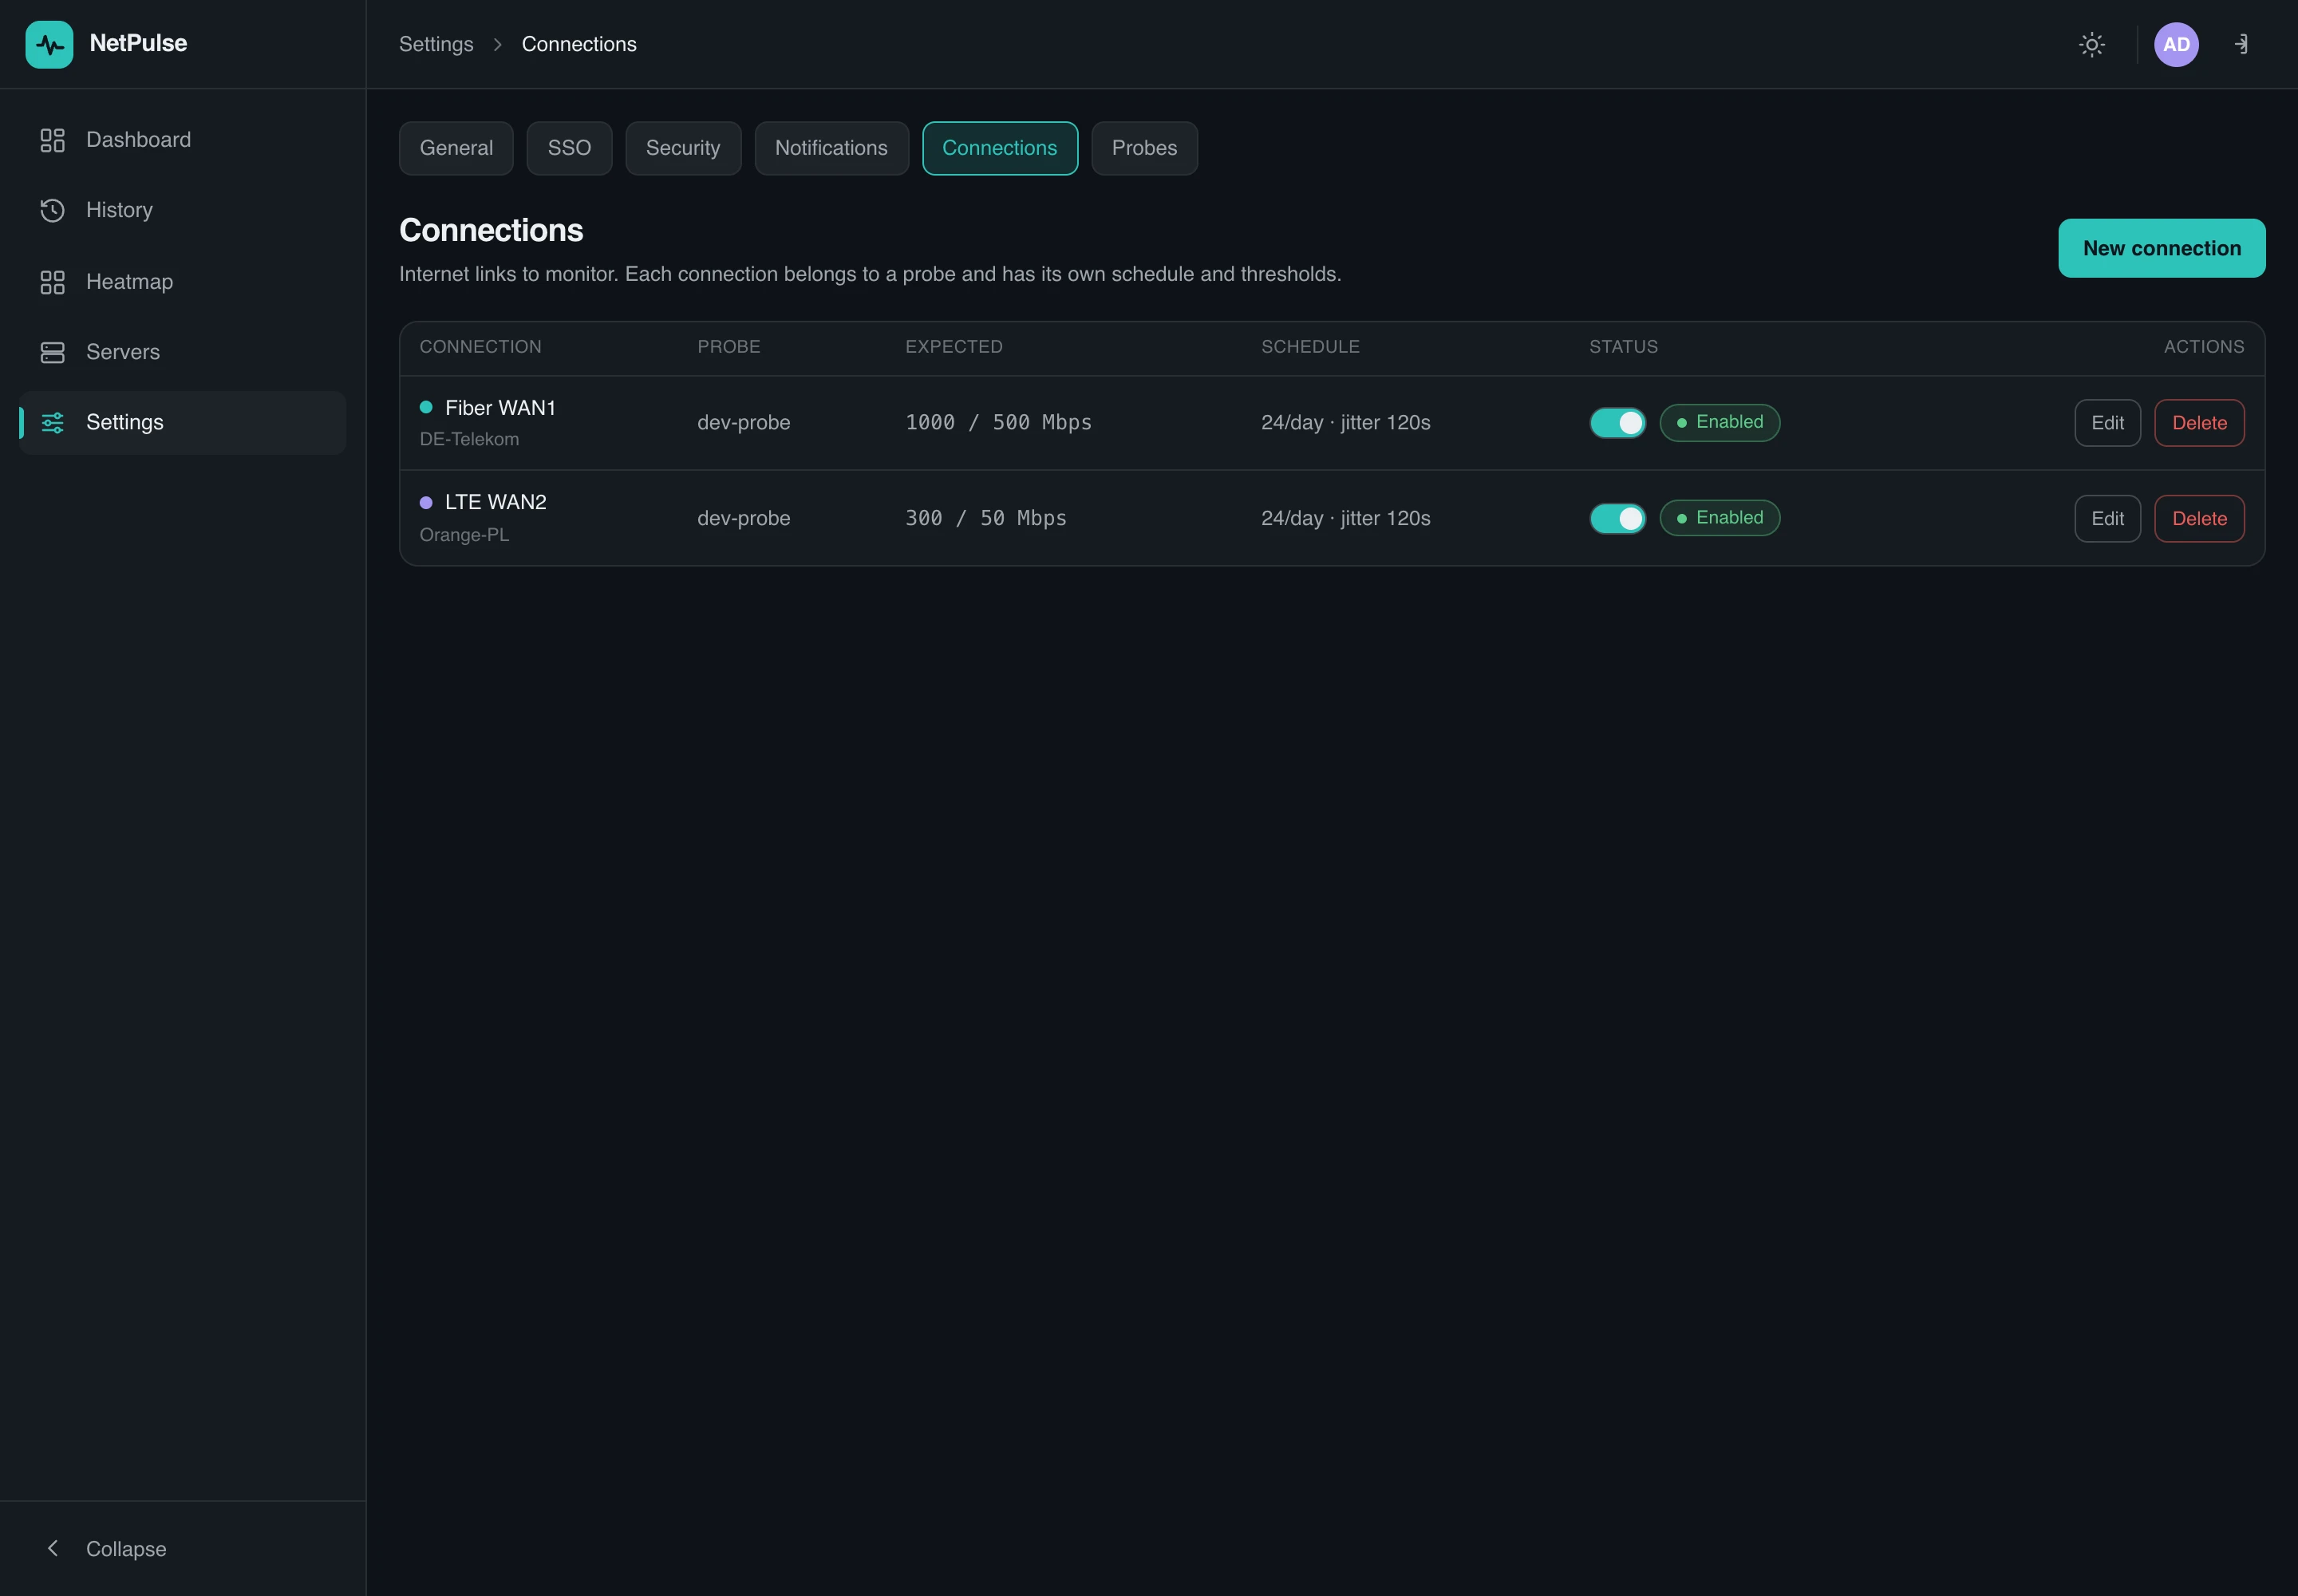
Connections
Each connection is an internet link with its own schedule, server pool and thresholds.
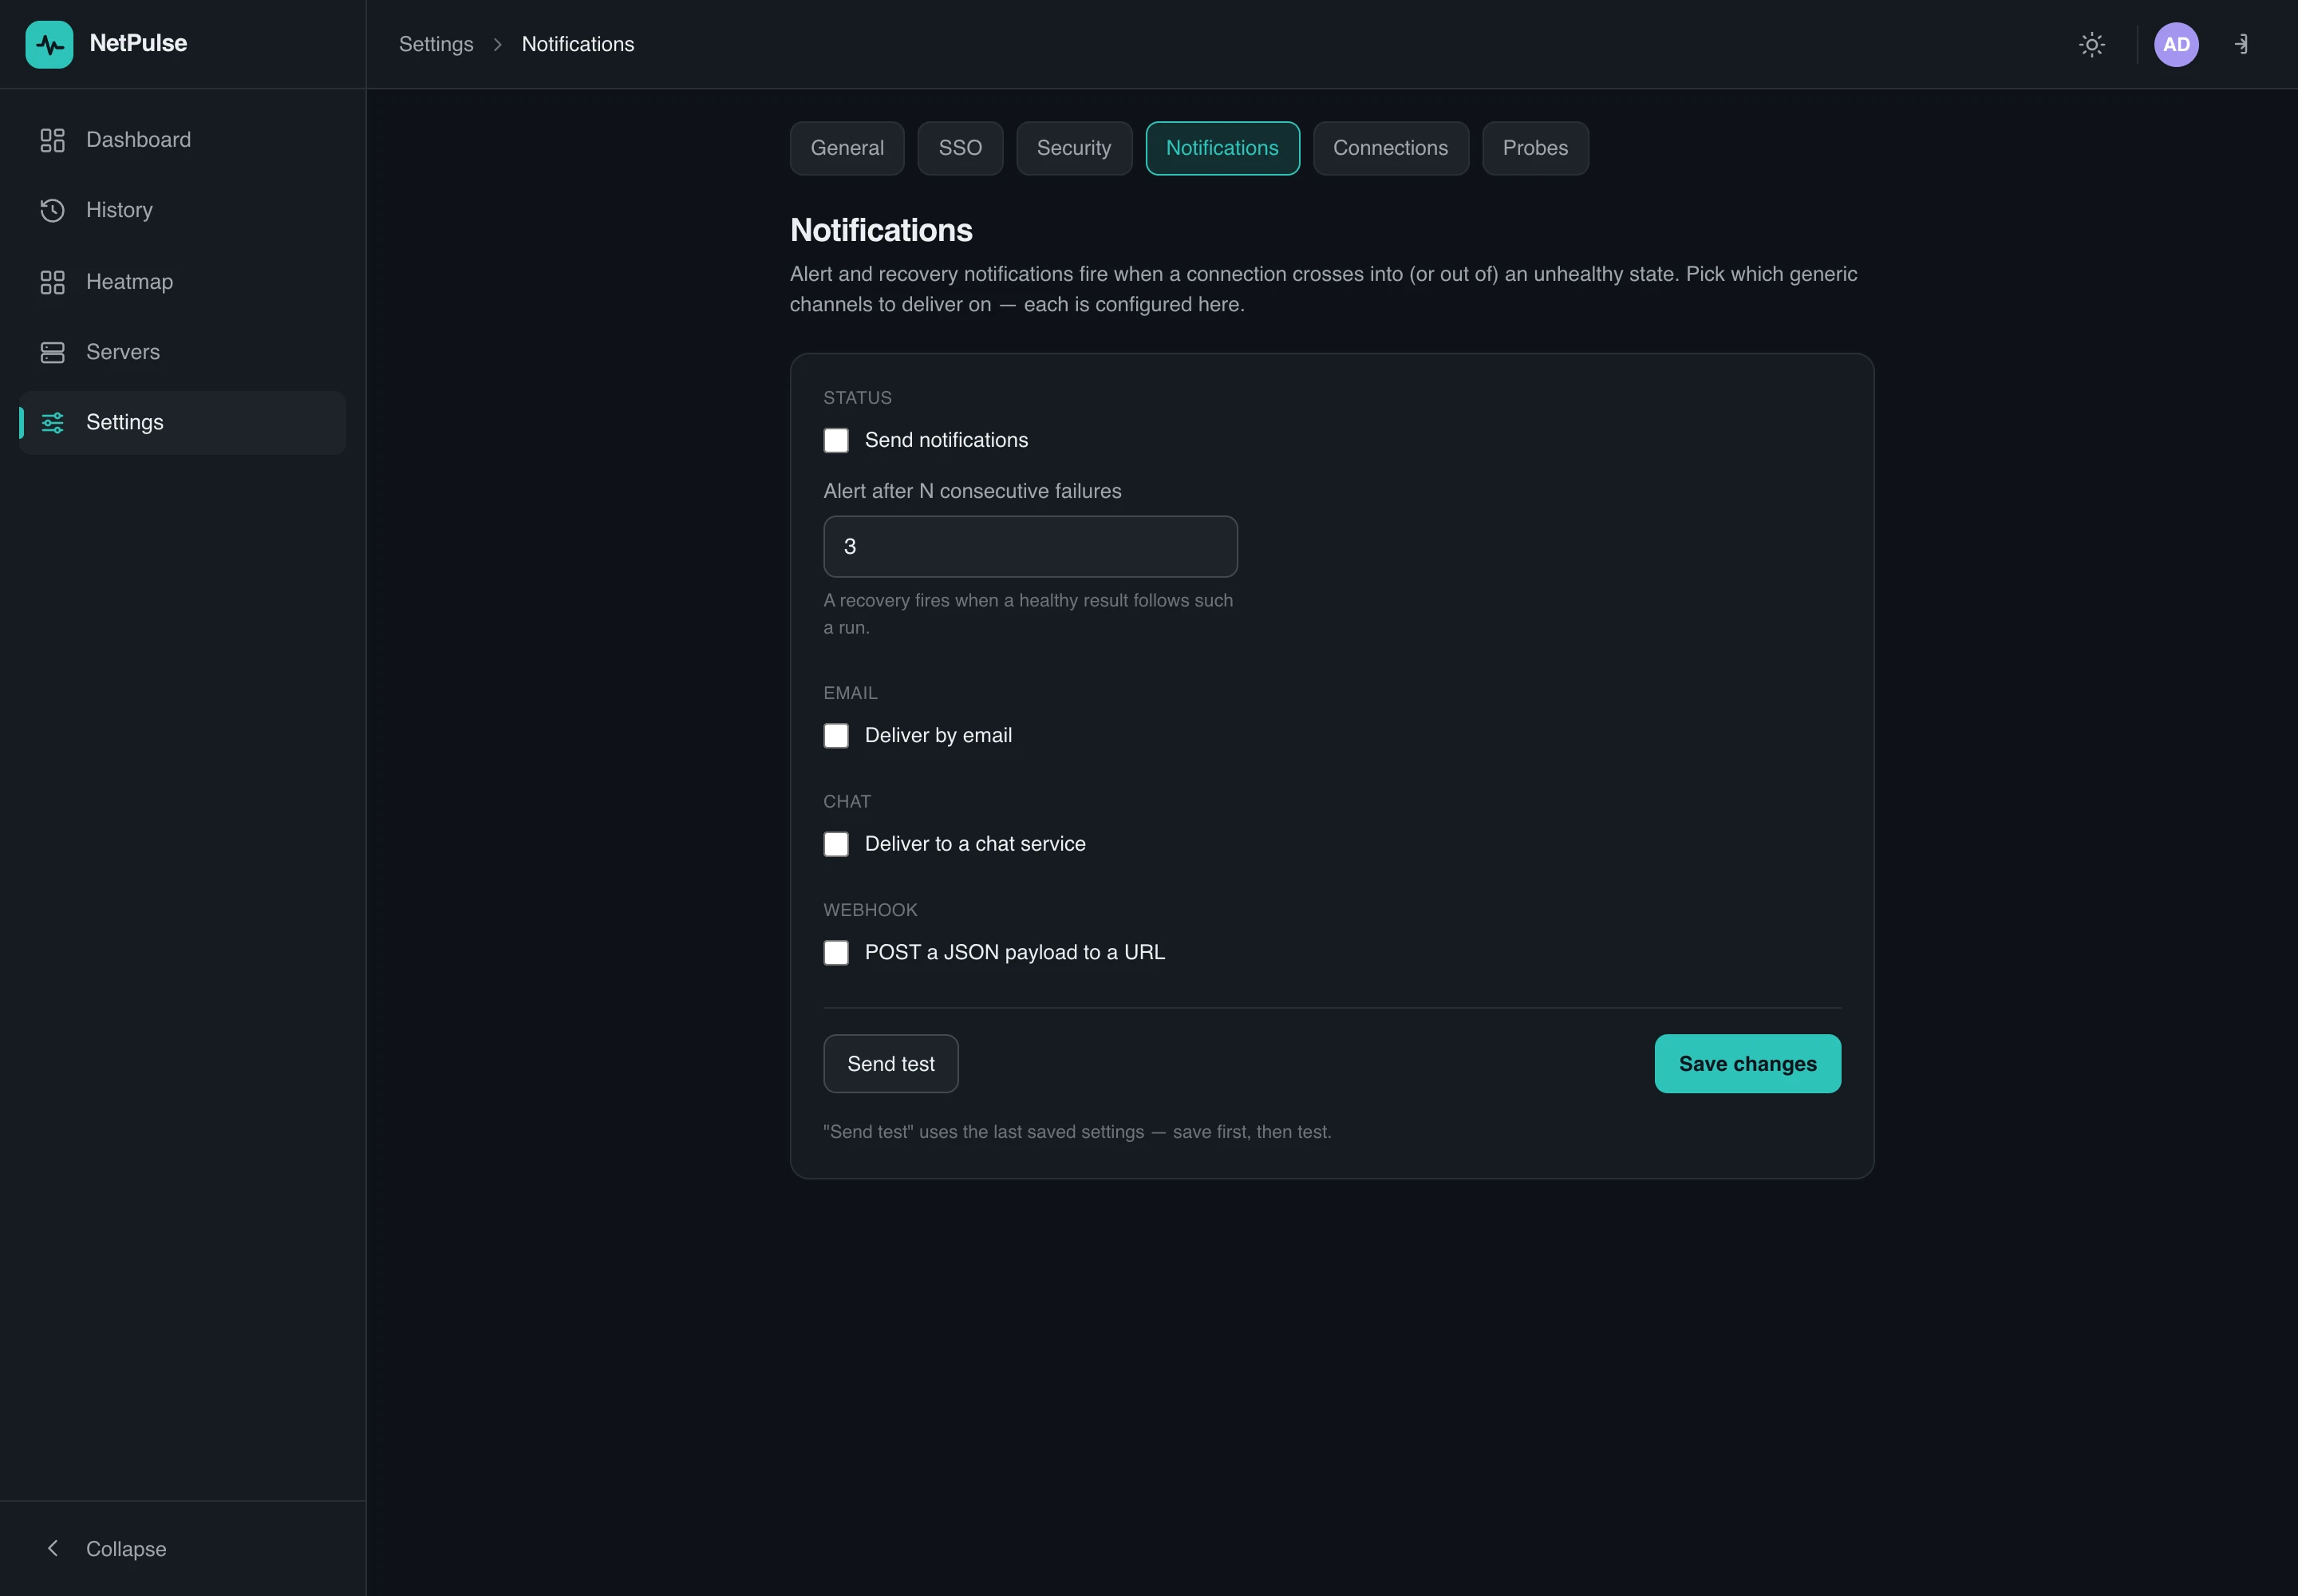
Alerts & notifications
Edge-debounced alert and recovery messages over email, chat (Slack / Telegram / Discord) or webhook, with a configurable failure threshold and a Send test.
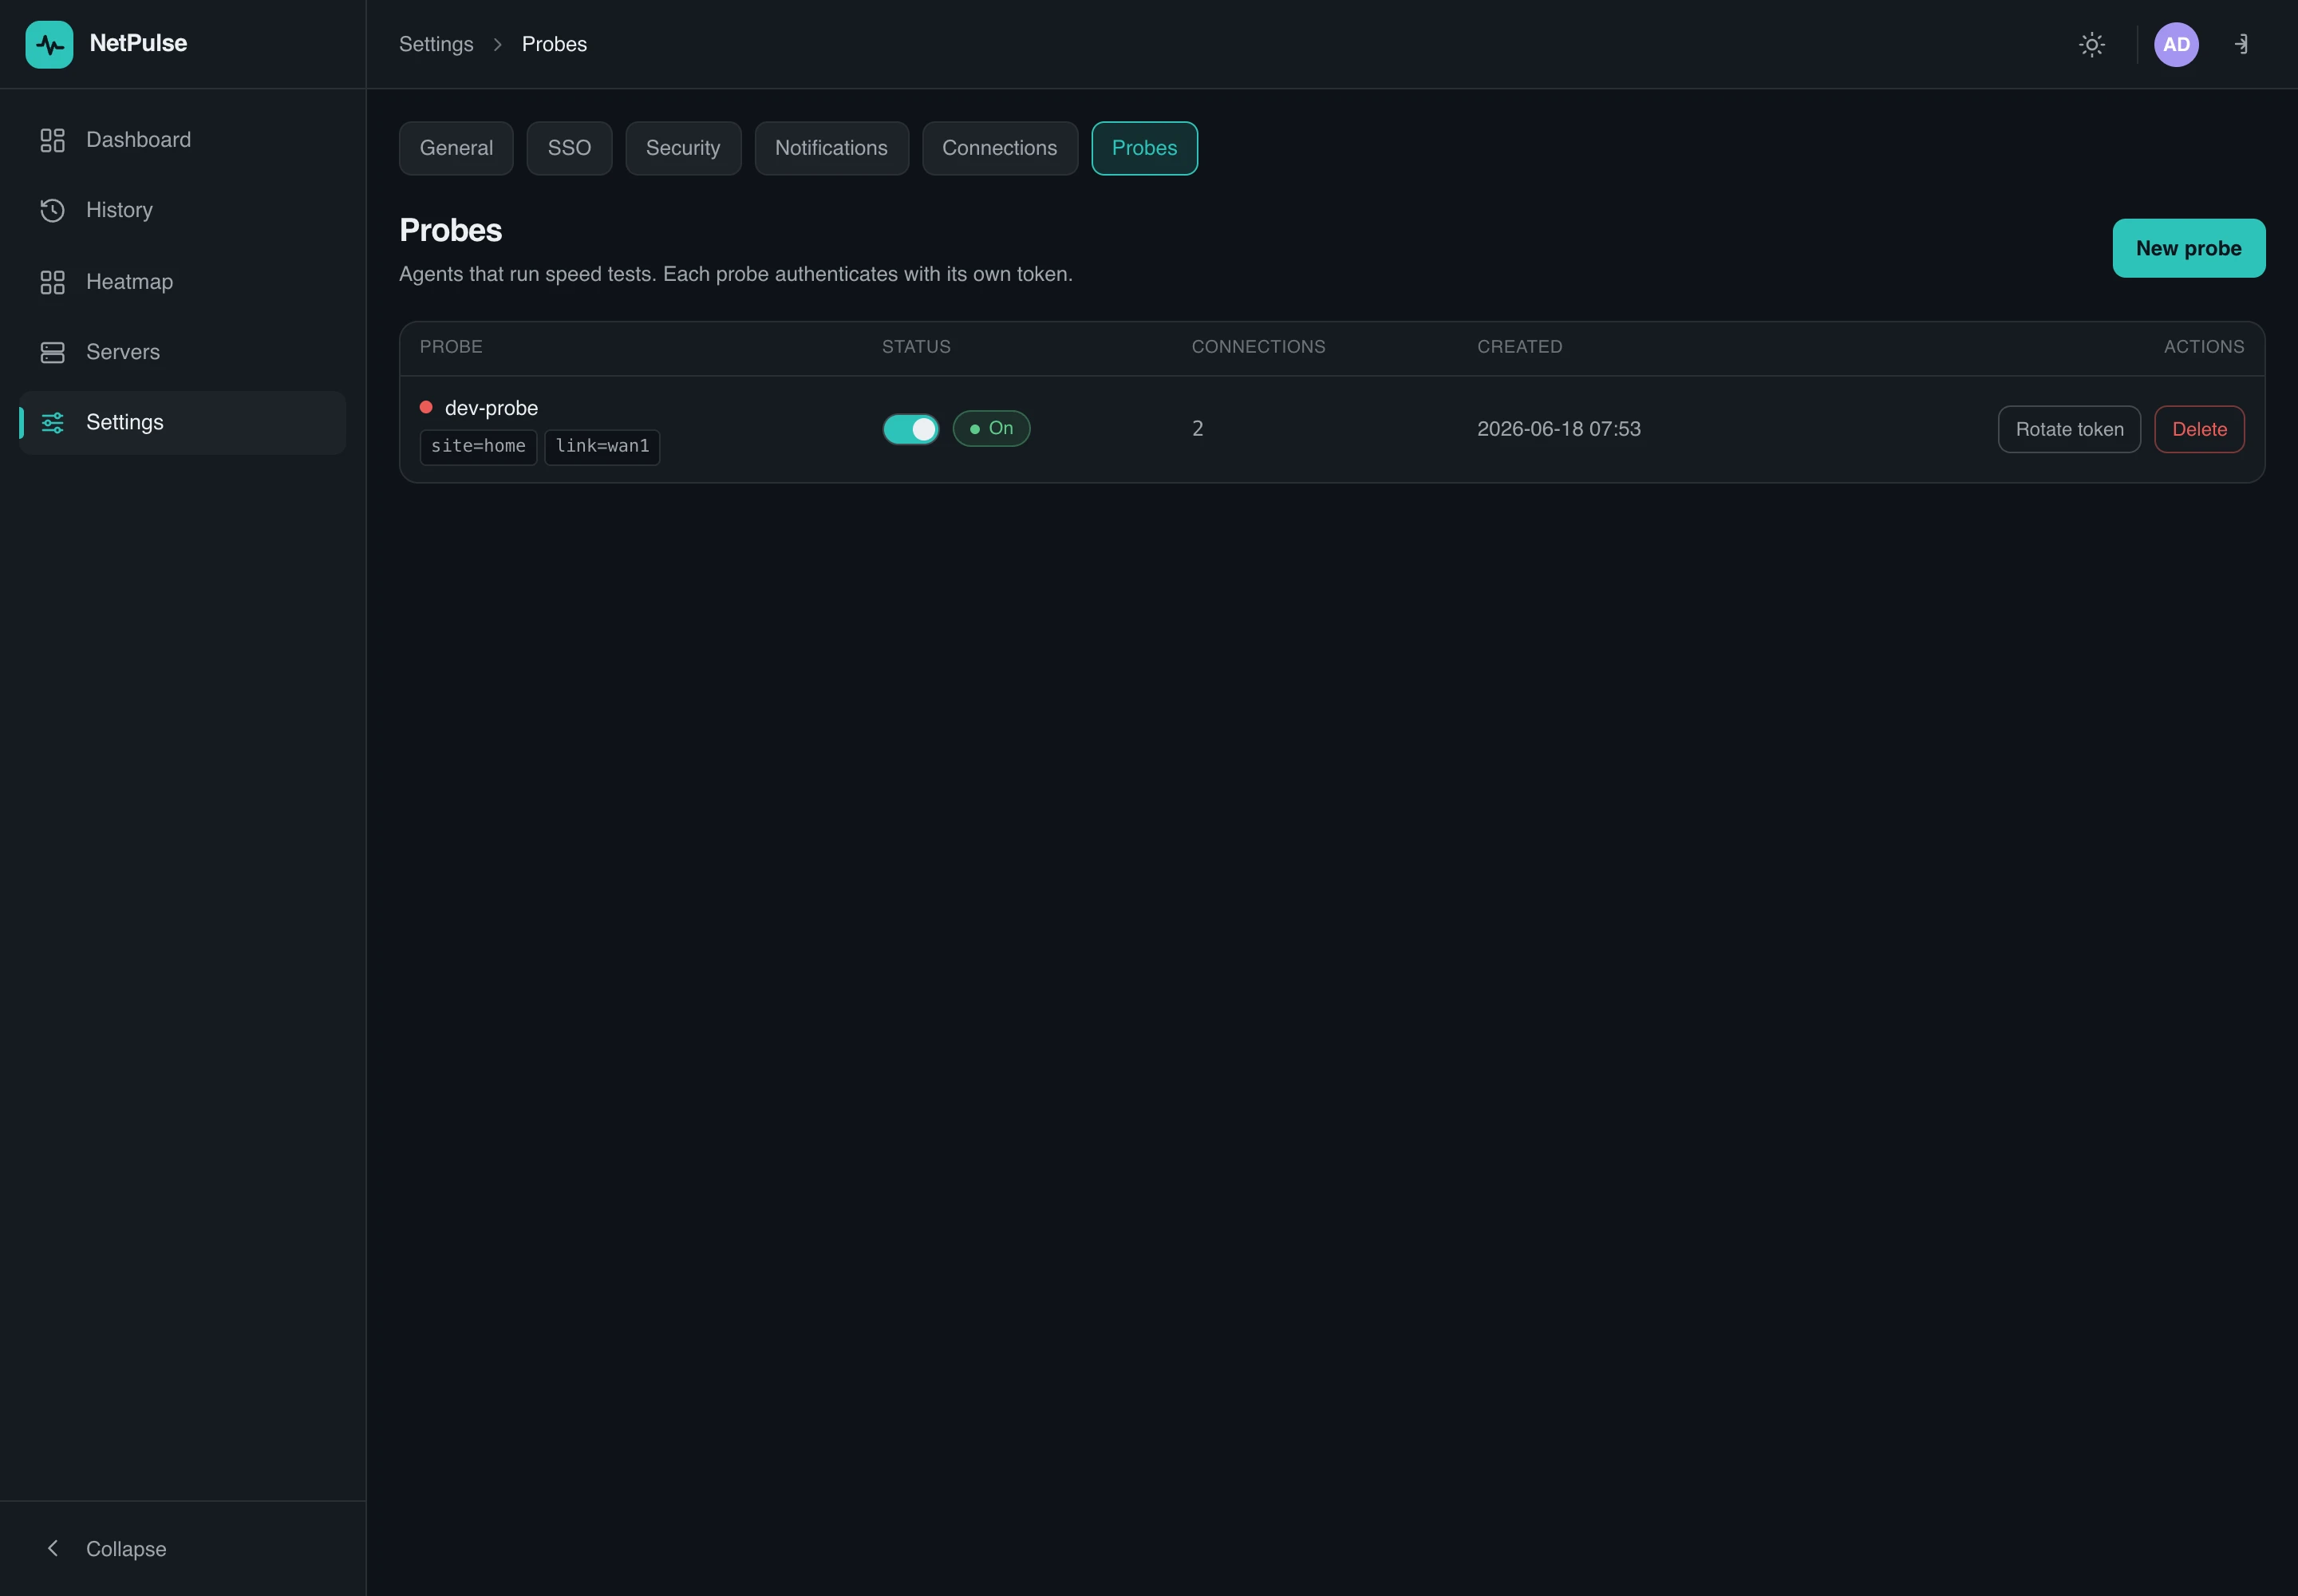
Probes
The agents that run the speed tests, each with its own bearer token.
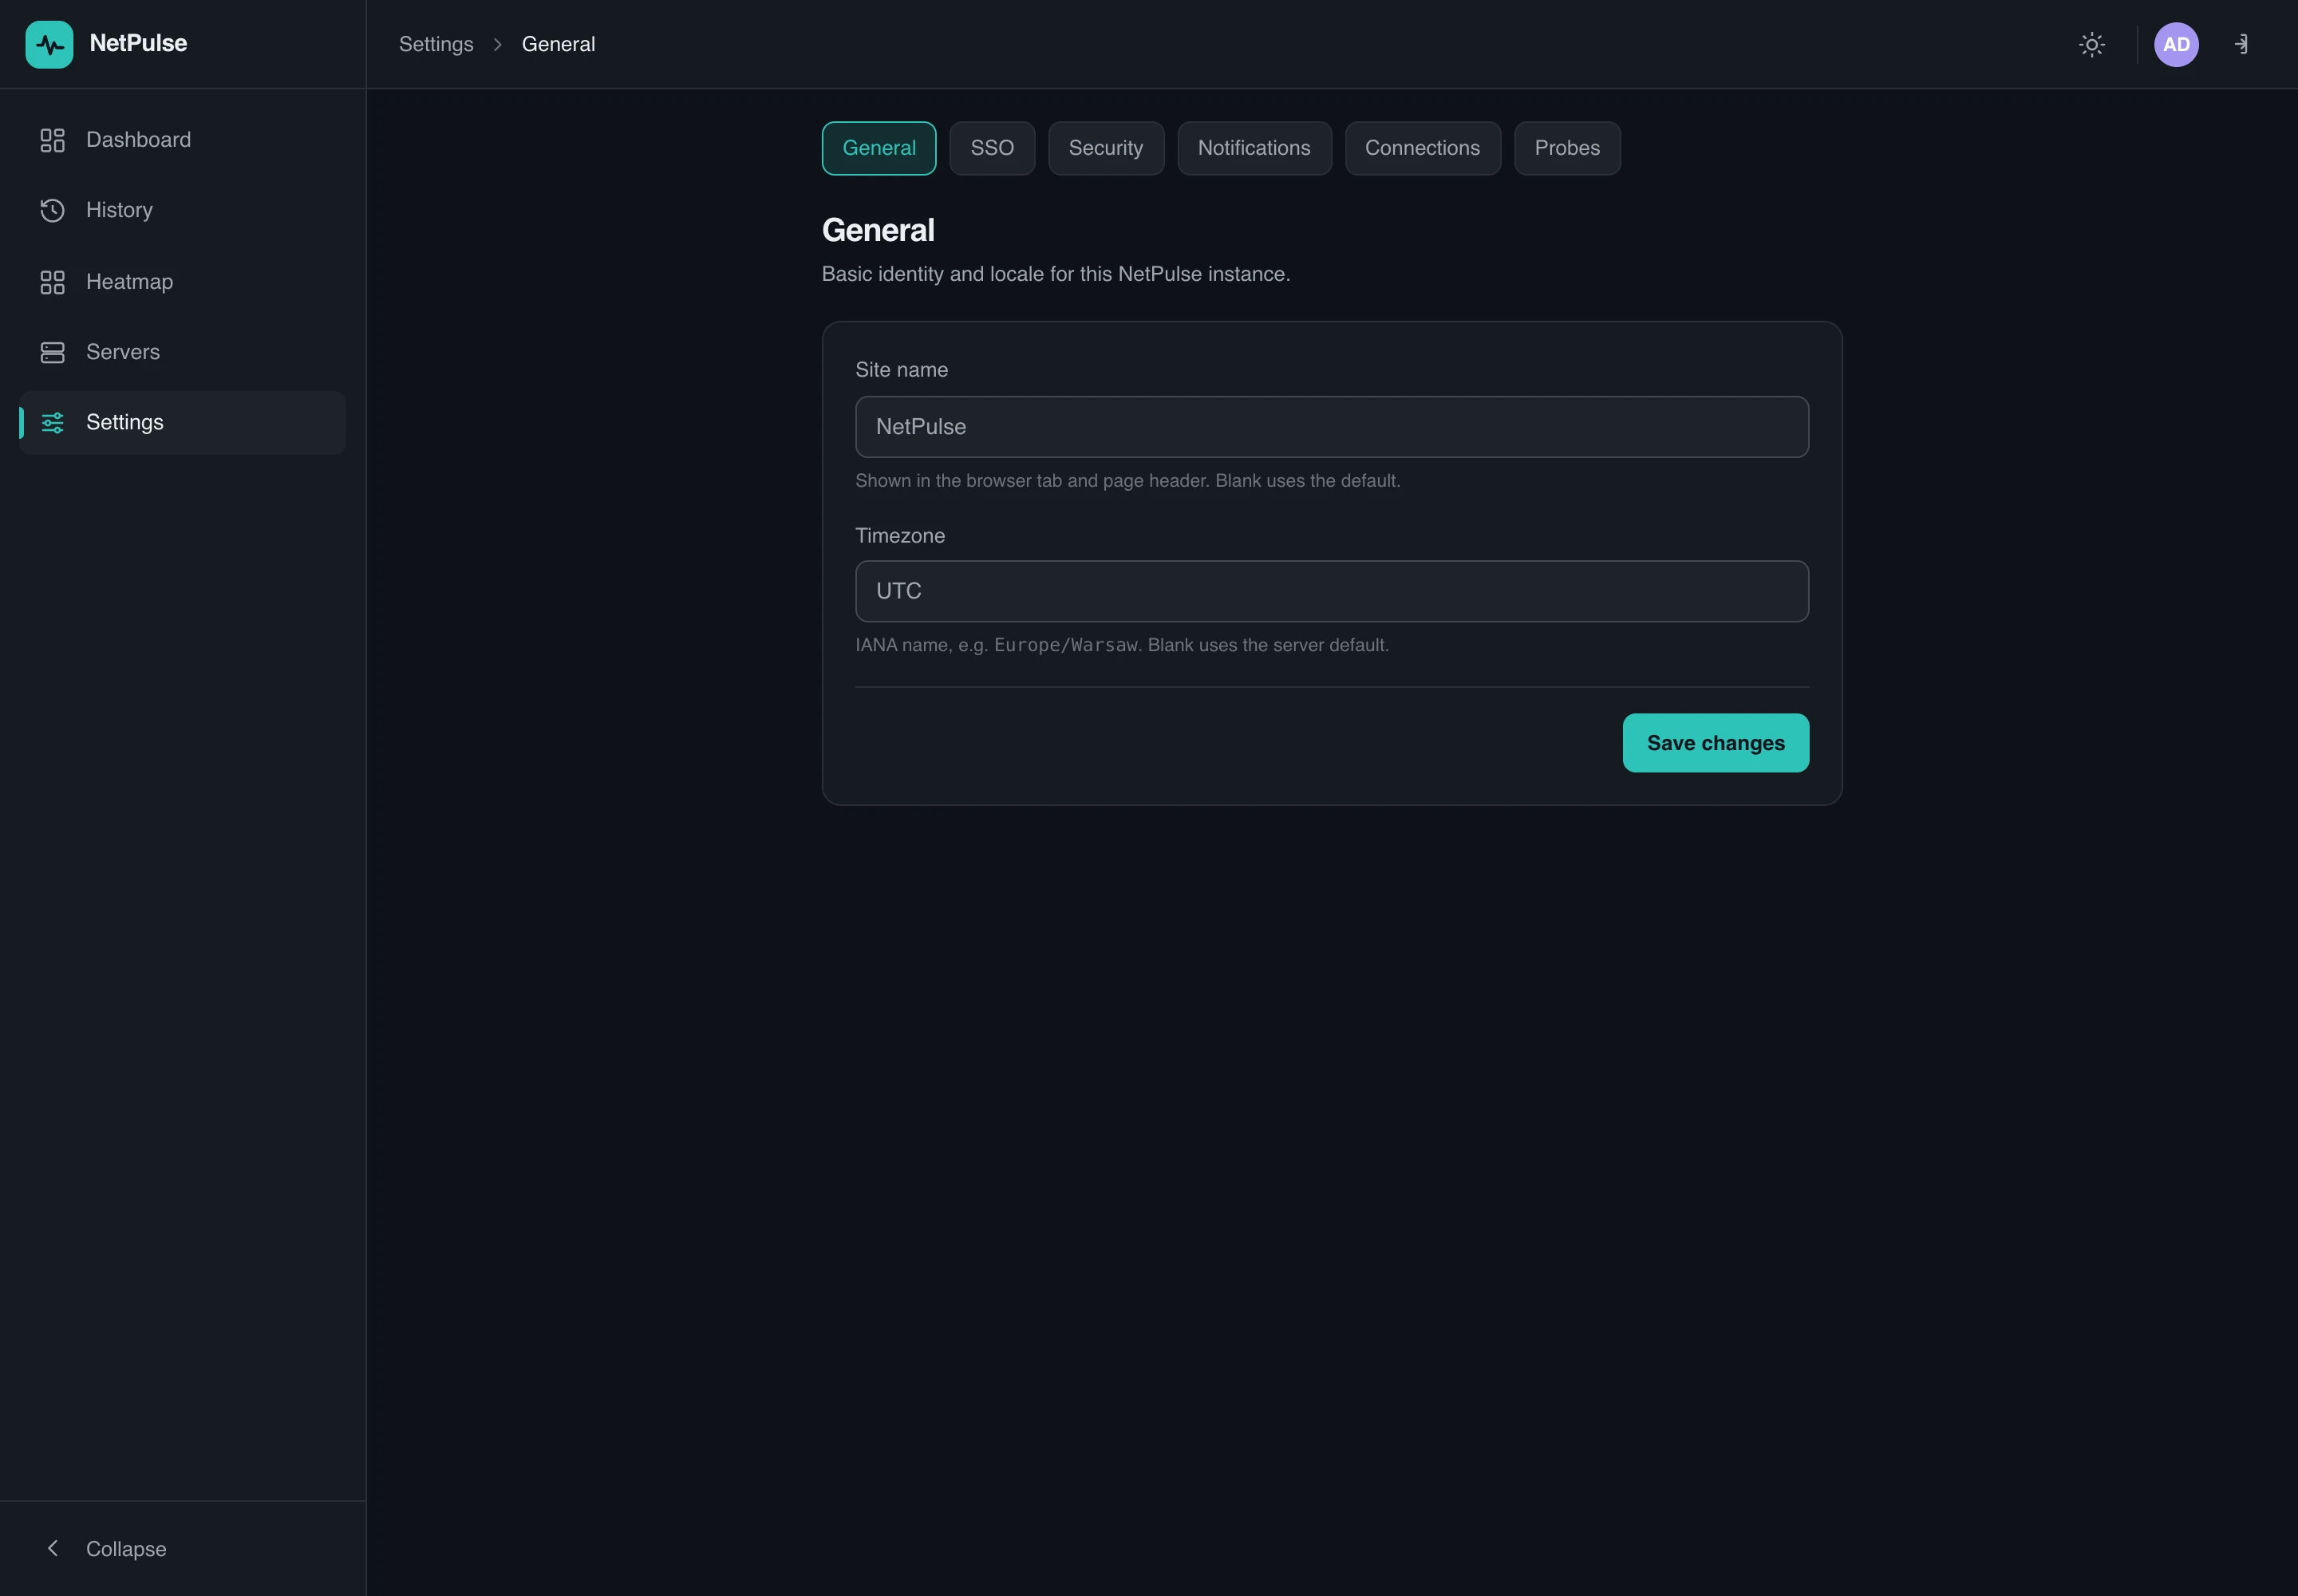
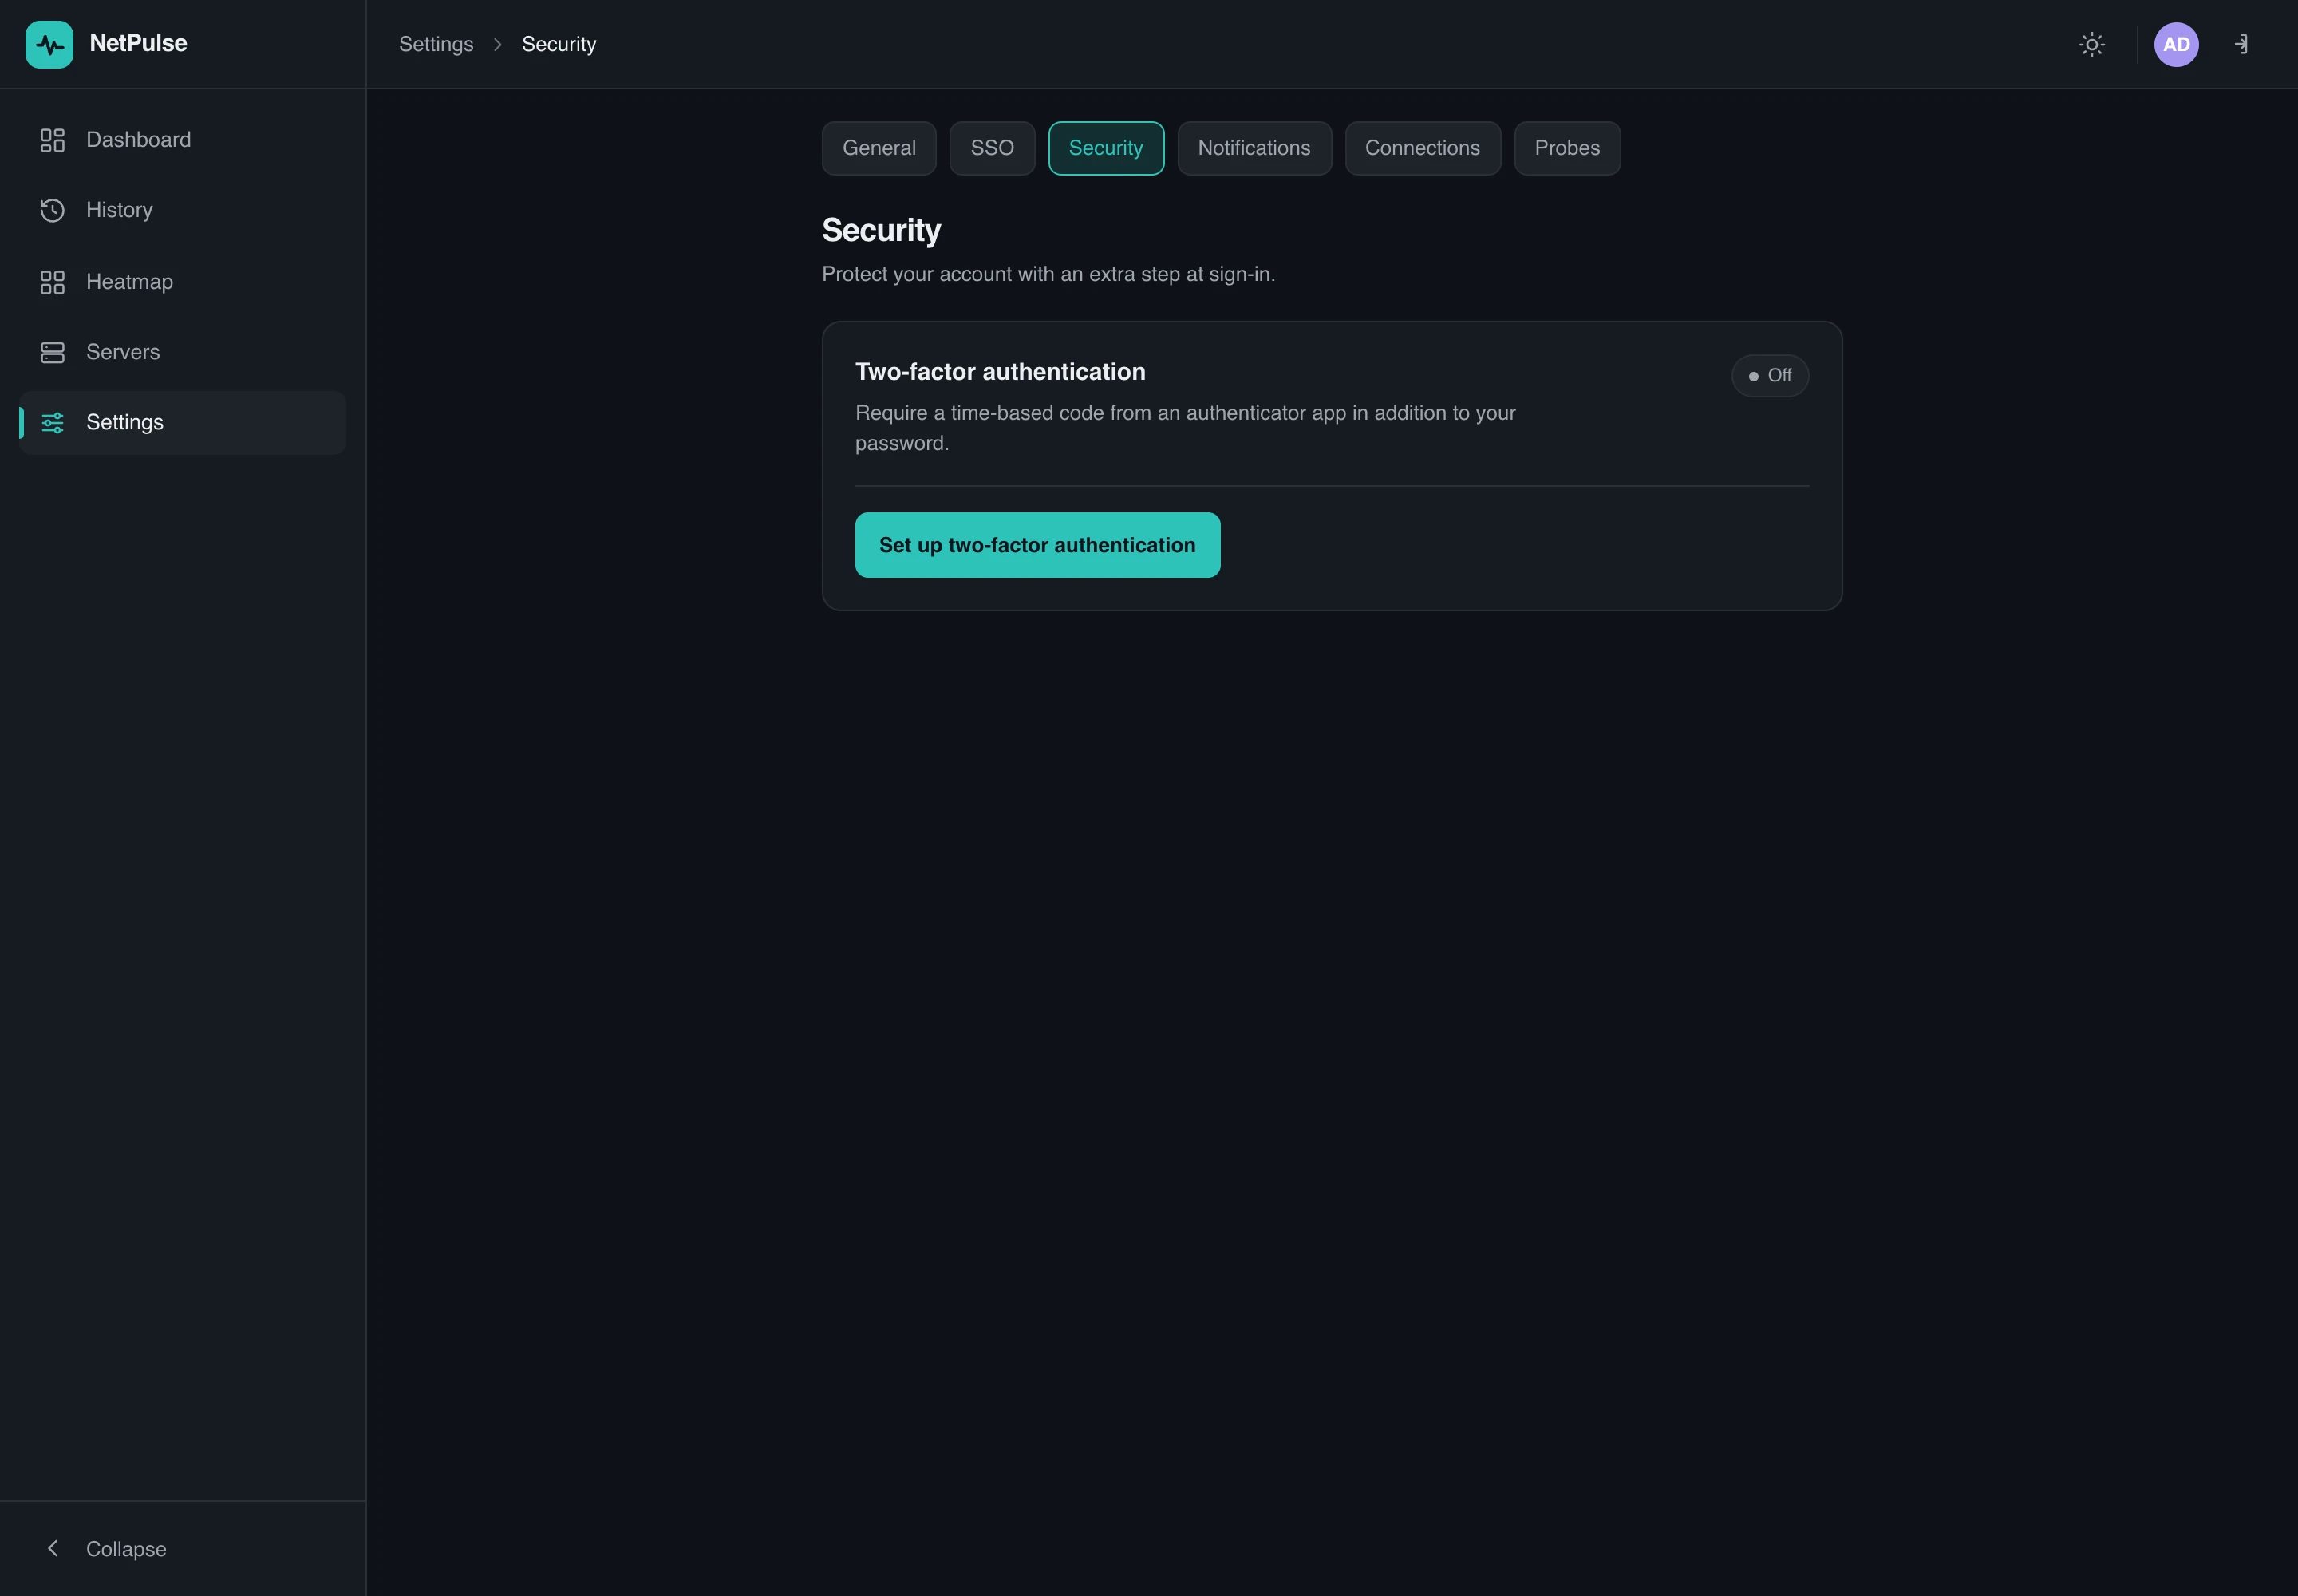
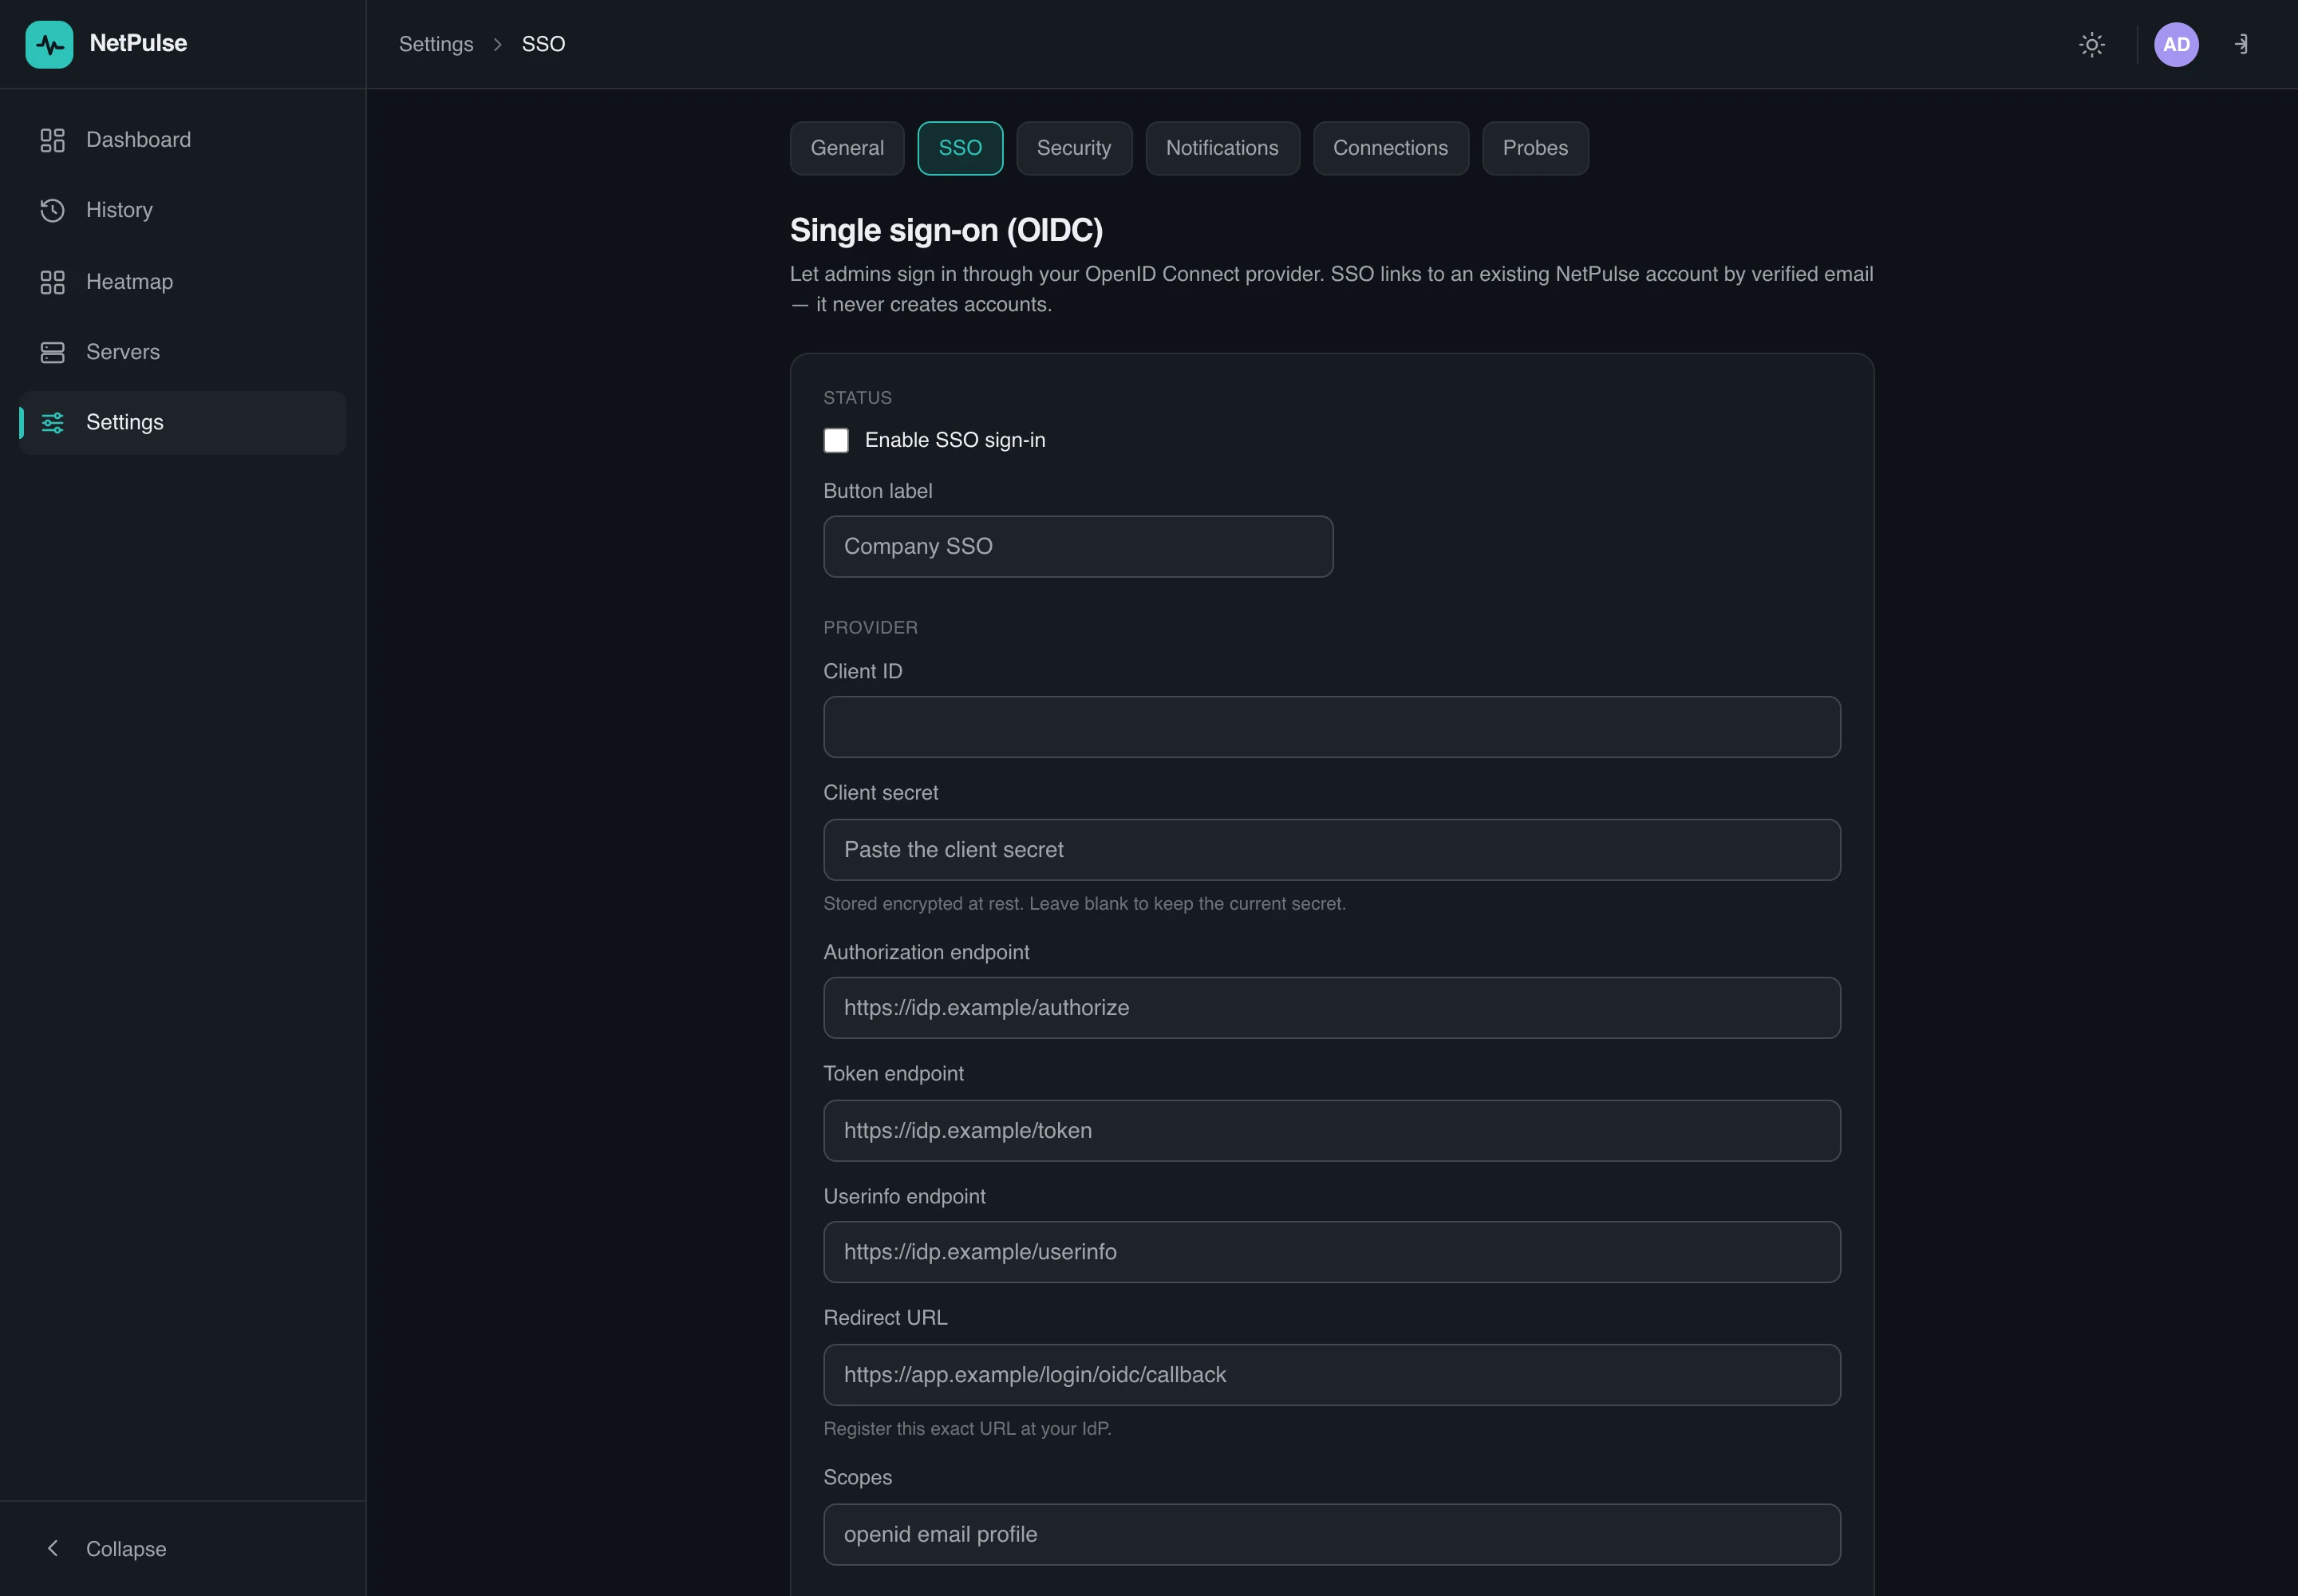
Settings & security
General settings, a security tab with optional TOTP two-factor, and optional OIDC SSO.
Sign in